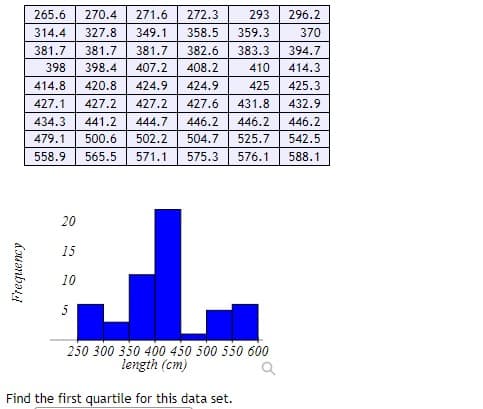
Find the first quartile for this data set.


Q: Ex: The following data represent the number of damaged pieces of spare parts for the production of a…
A: We have given the following data for the production of a company and the probability distribution…
Q: Q1: Let x1, X2. .., Xn, Xn+1 be a random sample of size n + 1,n > 1, from a distribution that is…
A:
Q: 2) The proportion of time, X, that a manufacturing machine is in operation during an 8-hour shift is…
A: Solution
Q: Four rowers weighing 152, 156, 160, and 164 pounds make up a rowing team. Calculate the sample mean…
A: Given population units are 152, 156, 160, 164. Sample of 2 size with replacement are selected. x1…
Q: Suppose you are estimating a wage regression, where salary is the dependent variable and age, years…
A: Given that, for estimating a wage regression, where salary is the dependent variable and age, years…
Q: Write True or False for the statement. If the statement is False, correct the statement. You are…
A: Normal Probability Plot: In Probability, these plots are used to know that the given dataset is…
Q: Claim: Most adults would erase all of their personal information online if they could. A software…
A: Given n=410 Pcap=0.57
Q: Is rgdp stationary? (Using Dickey-Fuller test) Explain in a very comprehensive ma
A: Null Hypothesis: H0: The values of rgdp are not stationary. Alternative Hypothesis: H1: The values…
Q: In the given situation below, identify the population standard deviation. “In a recent survey, the…
A:
Q: 6. If x~N(H, o2), which of the following is true about the distribution of x? A. The mean of x > x…
A:
Q: The accompanying data table contains chest deceleration measurements (in g, where g is the force of…
A:
Q: Construct a grouped frequency distribution table using 6 classes/groups. Follow the steps carefully.…
A: Given86,83,81,81,86,91,79,82,81,87,87,83,82,72,73,78,87,70,90,75,80,82,89,98,89,80,96,76,99,71,88,85…
Q: What was the cutoff for a failing score? Approximately what percentage of the students failed?
A: The scores on a psychology exam were normally distributed with a mean of 68 and a standard deviation…
Q: A tutorial school has been running IELTS mock examination for many years. Below is the summary…
A:
Q: What is the value of the finite population correction factor given a population consisting of 2, 3,…
A: Given that What is the value of the finite population correction factor given a population…
Q: Interpret the 95% CI.b. What assumption is needed for this CI to be valid?
A: We have given that Mean = 34.700 Standard deviation = 2.452 SE(Mean) = 0.775 The 95% C.I. is (…
Q: (b) If it costs P15 to repair one defective product, calculate the expected repair cost every time a…
A:
Q: Thelma and Louise each use their sample data to construct a confidence interval. Thelma’s interval…
A: It is given that Proportion p = 0.28 Thelma's interval = (0.242, 0.338) Louise's interval = (0.237,…
Q: Compute the 98% interval estimate of ? given ? = 3, n=15 and ?̅=18 a. 15.57 < µ < 20.53 b. 14.97…
A: Usig t distribution
Q: 4. Which of the following describe DATA The number of watches owned by 10 students The amount of…
A: Facts or information represents DATA.
Q: Example 15.12 On the basics of the following data, determine regression of Y on X: ΣΧ-231 ΣΥ-498…
A:
Q: how do i find the C in this problem and solve it. I am so confused by the entire problem, but have…
A: C=centile It is same percentile From the given data, We have to calculate percentile.
Q: A box contains a certain number of computer parts, a few of which are defective. Two parts are…
A: Given: A box contains a certain number of computer parts, a few of which are defective. Two parts…
Q: QUESTION 1. Over dinner, your friend mentions an article about a population explosion in Malaysia…
A:
Q: hand pairwise co
A: store size 1 2 3 4 small 350 352 338 438 medium 412 449 385 532 large 956 953 938 1049 very…
Q: 1. What is the resulting value when the maximum error is added from the sample mean? A. Interval…
A: Let M denote the sample mean And E denotes the maximum error. Note : Since you have asked multiple…
Q: professor went to a website for rating professors and looked up the quality rating and also the…
A: Given n=6
Q: respectively. Let f =A prove that 1. f has F distribution with r, and r, degrees of freedom 2. E(f)…
A:
Q: A hospital administrator wants to seeif there isa relationshipbetween the number of licensed beds…
A: For the given data Describe the relationship between the variables
Q: what will the margin of error be? Choose the answer that is closest to what you calculate, and try…
A: We have given that Favourable cases, X = 51 Sample size, n = 85 Sample proportion, p^ = X/n…
Q: (3) During your summer internship at a candy company, you are responsible for quality control on the…
A:
Q: In 1995, Cook County, Illinois (1.4 million households), conducted a study to determine how far the…
A: N=2518 Mean =42.6 Standard deviation =16.7 Average =42 We have to test hypothesis.
Q: Problem 2: Let X and Y be two independent random variables with E(X) = 1, E(Y) = 0, Var(X) = 4,…
A:
Q: * Draw a Frequency polygon, histogram and a cumu requency distribution for the following data: Class…
A: Frequency Polygon: Excel Procedure: Enter class and frequency in Excel>Select the data in…
Q: Question 10 > Given below are data that has approximately normal distribution. data data data data…
A: Given that, In an experiment to determine whether aspirin reduces the chance of having a heart…
Q: Exercise 2: The school board of Two Guns, Texas is deeply concerned that their public school…
A:
Q: Sketch the area under the standard normal curve over the indicated interval and find the specified…
A: The area under the standard normal curve can be found using the normal distribution table.
Q: Q 2/ In a certain city, the number of power outages per month is a random variable, having a…
A: Given,n=22p=0.7mean(μ)=npmean(μ)=22×0.7=15.4standard deviation(σ)=np(1-p)standard…
Q: As part of quality control, you carry out inspection of your product on a weekly basis. You set a…
A: Hello! As you have posted more than 3 sub parts, we are answering the first 3 sub-parts. In case…
Q: (10) Find the indicated probability. As a prize for winning a contest, the contestant is blindfolded…
A:
Q: how many chicks do we expect will hatch in the following time periods?
A: The incubation time for a breed of chicks is normally distributed with a mean of 36 days and…
Q: Group of six subjects, each taught using three different methods of teaching English, had the…
A: There are 3 independent samples which are 3 methods. We have to test whether there is a difference…
Q: You want to obtain a sample to estimate a population mean. Based on previous evidence, you believe…
A:
Q: With X, the weight (g) of a carrot in McGregor's field, X ~ N(200, 400) and X1, Xn an i.i.d. ....…
A:
Q: EXAMPLE :- How many 3 digits number can be formed using digits 1,6,8,9,3,7 without repeating any…
A: Here digits 1,6,8,9,3,7 from given 6 digit select 3 digit here use permutation
Q: Given a normally distributed population with a mean of 75 and a variance of 625, find: f) P(50 sxs…
A: Hello! As you have posted more than 3 sub parts, we are answering the first 3 sub-parts. In case…
Q: Consider the pdf shown. Determine (a) the constant b in terms of a. (b) P(X>a). (d) X, X2 and o² .…
A: As per bartleby guidelines we can solve only first three subparts and rest can be reposted.
Q: A hospital administrator wants to seeif there isa relationshipbetween the number of licensed beds…
A:
Q: Data about employment for males and females at Nyalikungu Maswa township are as shown in the table…
A: We have given that the data into cross-tabulation form. Note: According to Bartleby expert…
Q: In survival analysis, the outcome variable of interest is a binary variable coded 1 for having the…
A: We have given the following statement about the survival analysis.

Step by step
Solved in 2 steps with 2 images

- Find the positive geometric mean between 4 and 64.Date DJIA S&P 500 January 6 12,360 1,278 January 13 12,422 1,289 January 20 12,720 1,287 January 27 12,660 1,234 February 3 12,862 1,267 February 10 12,801 1,243 February 17 12,950 1,262 February 24 12,983 1,313 March 2 12,978 1,255 March 9 12,922 1,371 March 16 13,233 1,404 March 23 13,081 1,397 March 30 13,212 1,408 April 5 13,060 1,398 April 13 12,850 1,3704. The number of passengers (in thousands) for the leading U.S. passenger airlines in 2004 is indicated below. 91,570 86,755 81,066 70,786 55,373 42,400 40,551 21,119 16,280 14,869 13,659 13,417 13,170 12,632 11,731 10,420 10,024 9,122 7,041 6,954 6,406 6,362 5,930 5,585 5,427• Use the data to construct a grouped frequency distribution and a cumulative frequency distribution with a reasonable number of classes and comment on the shape of the distribution using graph.
- Men Women 27,230 18,659 18,502 27,311 4,696 7,269 27,478 19,457 26,239 12,561 10,359 14,738 22,726 14,386 15,870 20,920 28,027 11,722 23,137 15,867 14,627 13,660 8,930 13,339 10,629 18,665 20,063 20,605 16,877 4,618 6,262 16,006 20,008 21,885 10,782 19,115 22,832 15,496 16,188 15,317 17,628 31,024 18,057 9,470 7,408 15,224 5,791 5,205 28,402 8,973 10,785 17,953 14,676 15,928 14,933 19,094 10,691 18,605 18,769 15,874 14,835 33,737 7,999 6,706 18,016 8,486 15,995 11,064 10,946 29,614 16,468 19,580 15,413 19,026 11,006 18,875 17,121 20,775 11,150 15,109 15,229 20,726 7,278…hw 2 399.1 395 530.7 495.1 476.8 460.9 480.9 450.4 472.7 453.5 446.2 567.3 428.2 547.2 507.8 383 453.5 507.7 506 473.8 392.3 450.7 464.5 403.4 465.8 534.2 471.7 507.7 490.2 481.7 492.4 477.2 507.7 476.8 464.7 390.2 481.7 469 515.7 519.4 396.3 517.2 493.9 515.2 486.5 460.3 475.4 445.5 467.7 531 532.7 486.4 533.8 453.5 Find the first quartile for this data set.Q1 = Find the third quartile for this data set.Q3 = Find the interquartile range for this data set. IQR =Wages LOS 48.3355 94 49.0279 48 40.8817 102 36.5854 20 46.7596 60 59.5238 78 39.1304 45 39.2465 39 40.2037 20 38.1563 65 50.0905 76 46.9043 48 43.1894 61 60.5637 30 97.6801 70 48.5795 108 67.1551 61 38.7847 10 51.8926 68 51.8326 54 64.1026 24 54.9451 222 43.8095 58 43.3455 41 61.9893 153 40.0183 16 50.7143 43 48.84 96 34.3407 98 80.5861 150 33.7163 124 60.3792 60 48.84 7 38.5579 22 39.276 57 47.6564 78 44.6864 36 45.7875 83 65.6288 66 33.5775 47 41.2088 97 67.9096 228 43.0942 27 40.7 48 40.5748 7 39.6825 74 50.1742 204 54.9451 24 32.3822 13 51.713 30 55.8379 95 54.9451 104 70.2786 34 57.2344 184 54.1126 156 39.8687 25 27.4725 43 67.9584 36 44.9317 60 51.5612 102 This is the data given to us
- Date DJIA S&P 500 Day 1 35405.24 4536.54 Day 2 35629.33 4579.38 Day 3 35111.16 4467.44 Day 4 35089.74 4510.53 Day 5 35091.13 4493.87 Day 6 35462.78 4511.54 Day 7 35768.06 4577.18 Day 8 35241.59 4514.08 Day 9 34738.06 4408.64 Day 10 34566.17 4411.67 Day 11 34988.84 4461.07 Day 12 34934.27 4485.01 Day 13 34312.03 4390.26 Day 14 34079.18 4358.87 Day 15 33596.61 4314.76 Day 16 33131.76 4235.50 Day 17 33223.83 4278.70 Day 18 34058.75 4394.65 Day 19 33892.60 4363.94 Day 20 33294.95 4316.26 Day 21 33891.35 4396.54 Day 22 33794.66 4353.49 Day 23 33614.80 4318.87 Day 24 32817.38 4211.09 Day 25 32632.64 4180.70 Day 26 33286.25 4287.88 Day 27 33174.07 4249.52 Day 28 32944.19 4194.31 Day 29 32945.24 4183.11 Day 30 33544.34 4252.45 Day 31 34063.10 4367.86 Day 32 34480.76 4421.67 Day 33 34754.93 4473.12 Day 34 34552.99 4471.18 Day 35 34807.46 4521.61 Day 36 34358.50 4466.24 Day 37 34707.94 4510.16 Day 38 34861.24 4553.06…Male Female 27,767 20,516 17,413 24,972 6,080 4,900 28,523 17,661 25,137 11,901 9,821 17,562 21,857 9,865 16,491 21,047 27,687 12,095 23,361 20,089 12,272 16,244 9,584 14,395 13,562 15,467 23,151 23,501 20,071 5,715 142 19,698 21,957 21,640 8,722 18,345 21,058 16,616 17,940 15,249 15,001 28,849 20,938 6,825 6,151 17,111 8,370 4,197 27,687 12,989 11,589 16,879 12,021 13,322 13,709 20,292 12,888 19,417 17,879 14,061 13,743 32,349 11,268 8,738 22,102 10,475 16,788 11,971 10,387 28,702 13,809 22,947 15,644 16,386 11,044 20,101 17,933 20,564 11,413 14,483 11,842 17,349 6,794…Rank Player Money ($) Scoring Average DrDist DrAccu GIR 1 Vijay Singh 6,601,094 70.27 297.8 59.45 68.45 2 Phil Mickelson 5,188,875 70.28 295.7 55.27 65.81 3 Sergio Garcia 4,858,224 70.6 294.6 59.39 67.06 4 Kenny Perry 4,663,794 70.21 296 61.97 67.47 5 Anthony Kim 4,656,265 70.22 300.9 58.34 65.78 6 Camilo Villegas 4,422,641 70.6 293.3 58.15 64.6 7 Padraig Harrington 4,313,551 70.7 296.3 59.37 60.67 8 Stewart Cink 3,979,301 70.65 296.9 55.27 66.94 9 Justin Leonard 3,943,542 70.41 281.4 67.72 66.61 10 Robert Allenby 3,606,700 70.64 291.7 65.64 70.4 11 Jim Furyk 3,455,714 70.56 280.4 69.37 66.78 12 Ryuji Imada 3,029,363 71.13 278.6 59.64 61.39 13 Mike Weir 3,020,135 70.68 284.8 62.46 64.62 14 Geoff Ogilvy 2,880,099 71.38 292.1 58.18 61.89 15 K.J. Choi 2,683,442 71.01 286.1 61.38 65.48 16 Ben Curtis 2,615,798 70.96 284.7 67.2 63.45 17 Kevin Sutherland 2,581,311 70.22 291 61.93 68.2 18 Trevor Immelman 2,566,199 71.85 291.3 62.45 63.07 19 Ernie Els…
- Following are the quantities and prices for the years 2010 and 2018 for Kinzua Valley Geriatrics. Use 2010 as the base period. 2010 2018ItemPriceQuantity PriceQuantitySyringes (dozen)$6.94 1,332 $6.18 1,957 Thermometers 8.32 5 16.38 15 Advil (bottle) 4.69 283 8.89 295 Patient record forms (box) 6.19 924 9.82 1,027 Copier paper (box) 10.48 55 25.96 81 %media:2excel.ext% Click here for the Excel Data File a. Determine the simple price indexes. (Round your answers to 2 decimal places.) b. Determine the simple aggregate price index for the two years. (Round your answer to 2 decimal places.) c. Determine the Laspeyres price index. (Round your answer to 2 decimal places.) d. Determine the Paasche price index. (Round your answer to 2 decimal places.) e. Determine Fisher's ideal index. (Round your answer to 2 decimal places.).Company Competitor 1383 1153 2022 1067 2429 1296 901 1406 2219 1254 1896 1335 1910 1204 1539 1076 2048 1246 2881 1098 2395 1258 1349 955 2052 954 2675 1363 1588 1022 2704 1155 3148 1807 2822 1295 2217 1116 2260 1323 3040 1326 3137 1107 2977 1163 2599 1254 2412 1017 3187 938 2598 1270 2995 1042 3046 1318 3858 1497 2438 750 3243 1380 2764 1053 2944 932 3324 1097 2797 1193 3914 1271 2766 843 2273 780 3052 1095 3202 1290 3672 937 3957 1390 3274 1056 3788 1235 3502 1235 2942 999 3078 1066 3196 641 3141 1322 3579 1289 3895 1060 above is the excel data, please solve the excel part with formulas and explanation, thanksOnline Trailer Views (millions) Opening Weekend Box Office Gross ($millions) Online Trailer Views (millions) Opening Weekend Box Office Gross ($millions) 58.485 31.963 3.169 1.611 10.539 2.563 32.824 63.843 7.290 6.615 4.267 13.376 11.117 20.214 42.382 86.251 83.747 102.996 4.989 4.690 32.036 60.081 6.630 33.377 21.858 19.098 0.942 3.705 6.362 9.752 2.258 1.513 1.984 9.872 11.327 18.470 47.499 35.661 8.966 12.202 5.433 21.575 15.177 4.357 27.396 18.002 13.714 30.436 2.141 2.859 31.231 53.003 57.337 150.198 52.612 46.607 7.918 11.225 16.235 13.003 8.372 6.775 6.884 3.776 9.117 0.427 11.698 18.223 1.888 5.706 2.827 3.471 2.883 3.998 23.075…