Find the indicated z score. The graph depicts the standard normal distribution of bone density scores with mean 0 and standard deviation 1. 0.8340 The indicated z score is (Round to two decimal places as needed.)
Find the indicated z score. The graph depicts the standard normal distribution of bone density scores with mean 0 and standard deviation 1. 0.8340 The indicated z score is (Round to two decimal places as needed.)

Functions and Change: A Modeling Approach to College Algebra (MindTap Course List)
6th Edition
ISBN:9781337111348
Author:Bruce Crauder, Benny Evans, Alan Noell
Publisher:Bruce Crauder, Benny Evans, Alan Noell
Chapter5: A Survey Of Other Common Functions
Section5.3: Modeling Data With Power Functions
Problem 6E: Urban Travel Times Population of cities and driving times are related, as shown in the accompanying...

Related questions
Question
6 and. 7 solve both
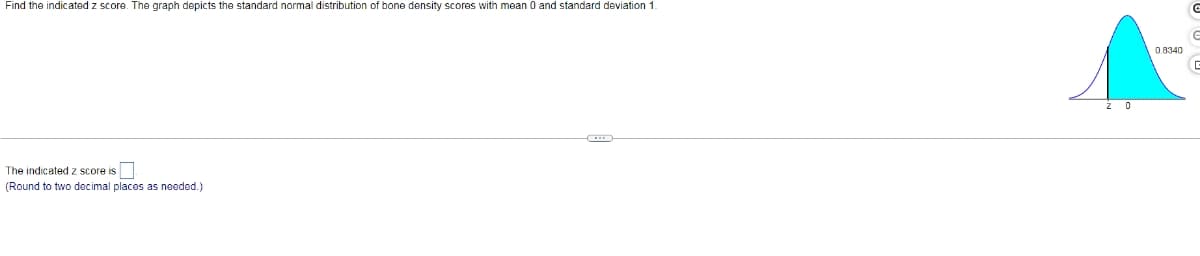
Transcribed Image Text:Find the indicated z score. The graph depicts the standard normal distribution of bone density scores with mean 0 and standard deviation 1.
0.8340
The indicated z score is
(Round to two decimal places as needed.)
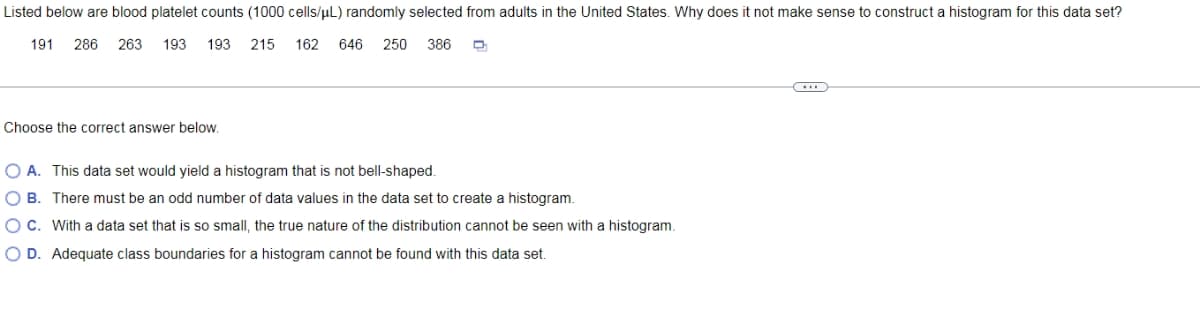
Transcribed Image Text:Listed below are blood platelet counts (1000 cells/uL) randomly selected from adults in the United States. Why does it not make sense to construct a histogram for this data set?
191
286
263
193
193 215
162
646
250
386
Choose the correct answer below.
O A. This data set would yield a histogram that is not bell-shaped.
O B. There must be an odd number of data values in the data set to create a histogram.
OC. With a data set that is so small, the true nature of the distribution cannot be seen with a histogram.
O D. Adequate class boundaries for a histogram cannot be found with this data set.
Expert Solution
This question has been solved!
Explore an expertly crafted, step-by-step solution for a thorough understanding of key concepts.

This is a popular solution!

Trending now
This is a popular solution!

Step by step
Solved in 2 steps with 1 images

Recommended textbooks for you
Functions and Change: A Modeling Approach to Coll…
Algebra
ISBN:
9781337111348
Author:
Bruce Crauder, Benny Evans, Alan Noell
Publisher:
Cengage Learning

Mathematics For Machine Technology
Advanced Math
ISBN:
9781337798310
Author:
Peterson, John.
Publisher:
Cengage Learning,

Glencoe Algebra 1, Student Edition, 9780079039897…
Algebra
ISBN:
9780079039897
Author:
Carter
Publisher:
McGraw Hill
Functions and Change: A Modeling Approach to Coll…
Algebra
ISBN:
9781337111348
Author:
Bruce Crauder, Benny Evans, Alan Noell
Publisher:
Cengage Learning
Mathematics For Machine Technology
Advanced Math
ISBN:
9781337798310
Author:
Peterson, John.
Publisher:
Cengage Learning,
Glencoe Algebra 1, Student Edition, 9780079039897…
Algebra
ISBN:
9780079039897
Author:
Carter
Publisher:
McGraw Hill