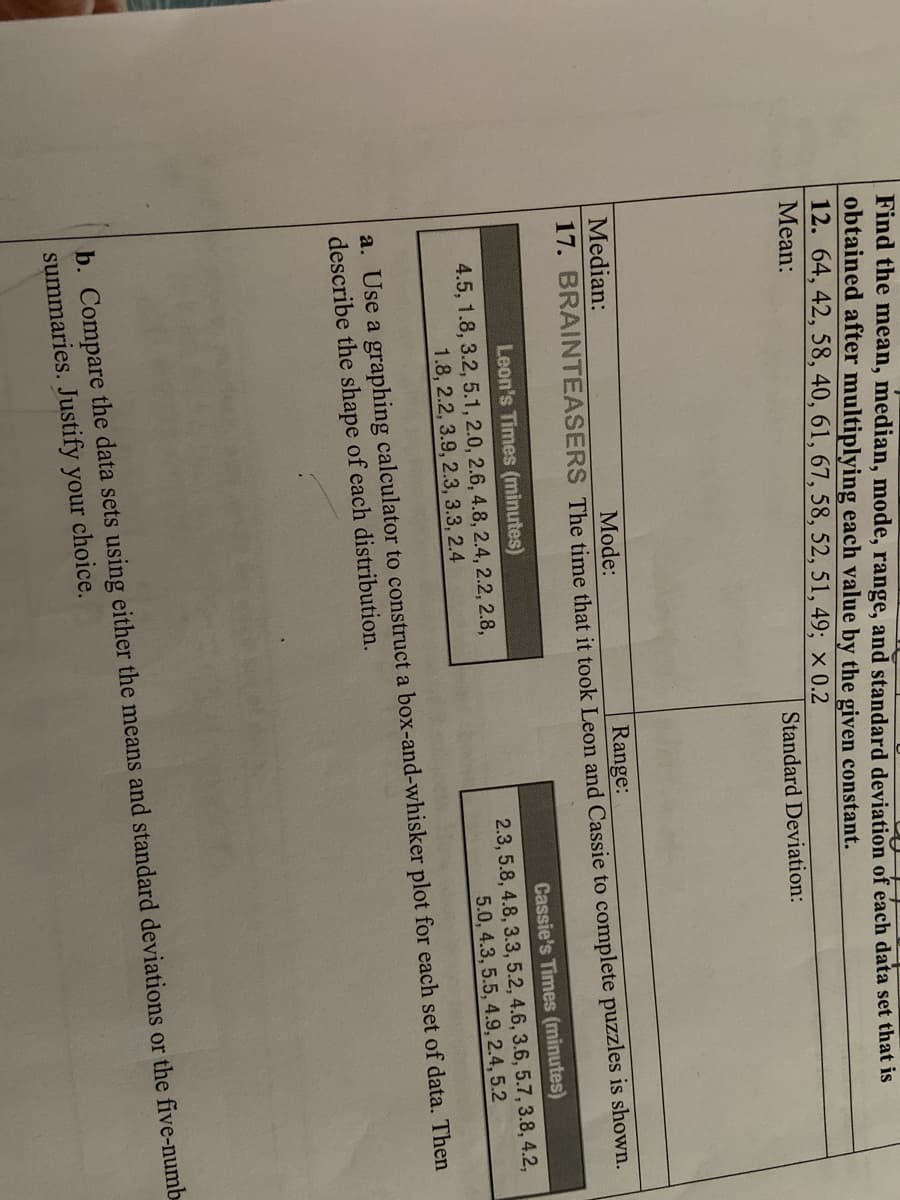
Find the mean, median, mode, range, and standard deviation of each data set that is obtained after multiplying each value by the given constant. 12. 64, 42, 58, 40, 61, 67, 58, 52, 51, 49; × 0.2 Mean: Standard Deviation: Median: Range: 17. BRAINTEASERS The time that it took Leon and Cassie to complete puzzles is shown. Mode: Leon's Times (minutes) Cassie's Times (minutes) 4.5, 1.8, 3.2, 5.1, 2.0, 2.6, 4.8, 2.4, 2.2, 2.8, 1.8, 2.2, 3.9, 2.3, 3.3, 2.4 2.3, 5.8, 4.8, 3.3, 5.2, 4.6, 3.6, 5.7, 3.8, 4.2, 5.0, 4.3, 5.5, 4.9, 2.4, 5.2 a. Use a graphing calculator to construct a box-and-whisker plot for each set of data. Then describe the shape of each distribution. b. Compare the data sets using either the means and standard deviations or the five-numb summaries. Justify your choice.


Unitary Method
The word “unitary” comes from the word “unit”, which means a single and complete entity. In this method, we find the value of a unit product from the given number of products, and then we solve for the other number of products.
Speed, Time, and Distance
Imagine you and 3 of your friends are planning to go to the playground at 6 in the evening. Your house is one mile away from the playground and one of your friends named Jim must start at 5 pm to reach the playground by walk. The other two friends are 3 miles away.
Profit and Loss
The amount earned or lost on the sale of one or more items is referred to as the profit or loss on that item.
Units and Measurements
Measurements and comparisons are the foundation of science and engineering. We, therefore, need rules that tell us how things are measured and compared. For these measurements and comparisons, we perform certain experiments, and we will need the experiments to set up the devices.

Step by step
Solved in 2 steps


