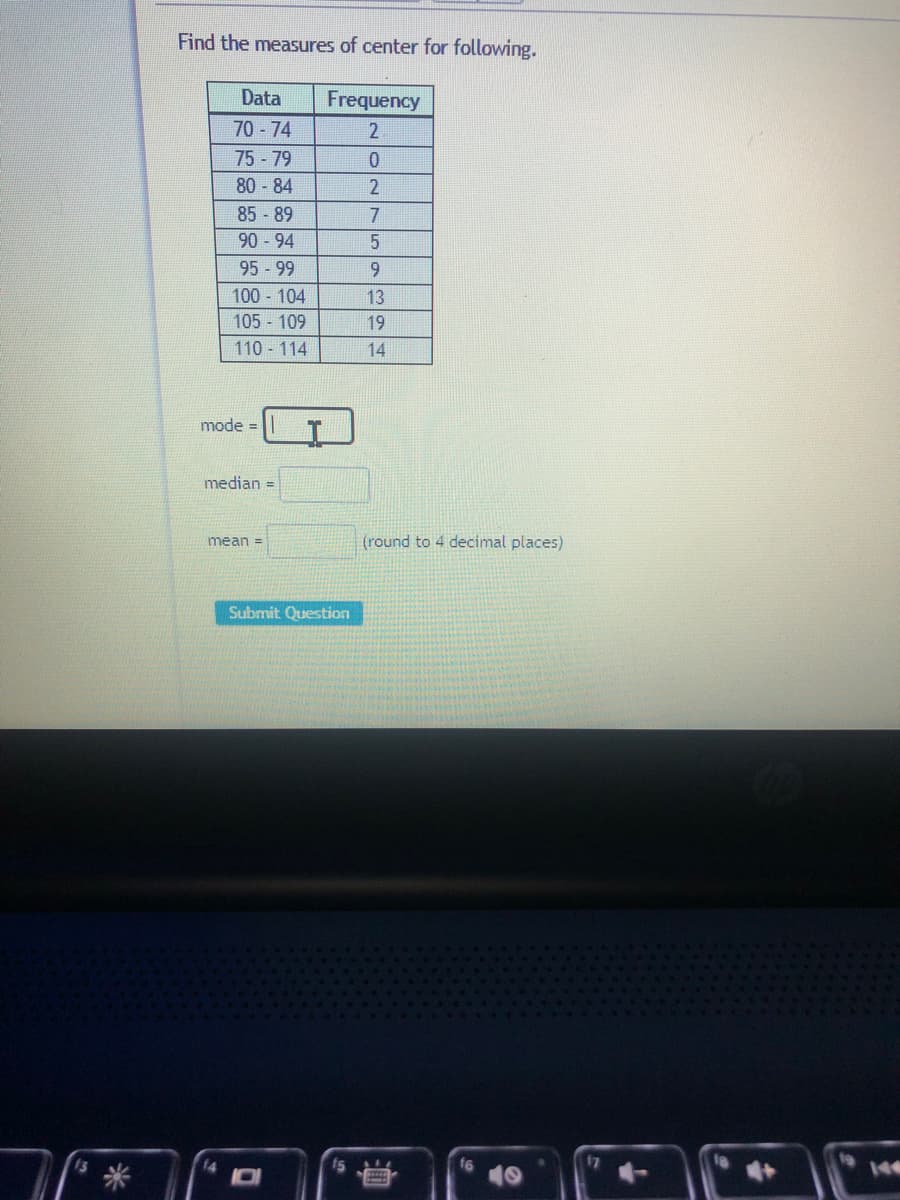
Find the measures of center for following. Data Frequency 70 74 2 75 79 80-84 85 -89 7 90-94 95 -99 100 104 13 105 109 110 114 19 14 LI mode = median = mean = (round to 4 decimal places)


Q: Find the measures of center for following. Data Frequency 30 - 34 1 35 - 39 0 40 - 44 4…
A: Consider the preliminary calculations given below:
Q: How hot does it get in Death Valley? The following data are taken from a study conducted by the…
A: It provided that the sample size of ground temperature (n) is 14.Consider X is defined as the ground…
Q: Approximate the mean for following GFDT. Data Frequency 30 - 34 12 35 - 39 22 40 - 44 11 45 - 49 7…
A: Given Data: Data Midpoint (x) Frequency (f) xf 30-34 32 12 384 35-39 37 22 814 40-44 42 11…
Q: a) Frequency (f) fx X? efi 15 6 90 1350 225 6 20 11 220 4400 400 17 25 17 425 10625 625 34 30 24 720…
A: Note: "Since you have posted a question with multiple sub -parts, we will solve first three sub…
Q: Calculate the mode, mean, and median salary for given data. (Salary is $1000) Salary 15-30…
A: Given data:
Q: Find the mean, the median, and mode for the pay rates in the given frequency distribution. Round…
A: Solution :-
Q: A Moving to another question will save this response Question 6 Find the mean of grouped data below.…
A: Class Frequency (f) Mid value (x) f⋅x 0.95-2.95 10 1.95 19.5 2.95-4.95 15 3.95 59.25…
Q: The durations (minutes) of 26 electric power outages in the community of Somando Heights over the…
A: (A) Sample size = n = 26. mean=∑xn=34+...+2026=33.19 Arrange the data in ascending order.…
Q: The revenue (in millions of dollars) for a company from 2007 to 2016 is given in the following…
A:
Q: The durations (minutes) of 26 electric power outages in the community of Sonando Heights over the…
A: Given data is32,47,26,69,26,9,57,10,51,5,17,47,40,99,31,20,14,48,24,2,18,25,87,28,14,17
Q: Approximate the median for following GFDT. (Report answer as the midpoint of the class containing…
A: The given data set with cumulative frequencies is as follows Data Frequency Cumulative frequency…
Q: Q # 3 Calculate Hamonic Mean and also Geometric Mean from the following discrete group data; Weight…
A: Given: Let x be a random variable that represents the weights (grams). The calculations for the…
Q: For the data below construct the frequency distribution table with 5 classes and after that find: 1)…
A: Given data is appropriate for measures of central tendency to find the central value for the given…
Q: Find the mean for the following data: Student Age (years) Number of Students 18 - 20 21 - 23 230 152…
A:
Q: 'he following table of grouped data represents the weight (in pounds) of 100 licro towers. Calculate…
A:
Q: The data sets below show the price that a homeowner paid, per therm, for natural gas during each of…
A:
Q: Find the mean of the data summarized in the given frequency distribution. Compare the computed mean…
A: From the provided information, The table is as follow: Speed (miles per hour) 42-45 46-49…
Q: Here is a frequency distribution table (FDT) for a small data set: frequency 14 data value 49 50 18…
A: Calculations for the measures of central tendency S.No. x f cf fx 1 49 14 14 686 2 50 18…
Q: Low Temperature ( o F) | 40– 44 45–49 4 Find the mean of the data summarized in the given frequency…
A: 40-44 1 42 42 45-49 4 47 188 50-54 12 52 624 55-59 5 57 285 60-64 1 62 62
Q: Approximate the measures of center for following GFDT Data Frequency 50-54 10 55-59 23 60 64 13 65-…
A: Using the given data, Data Frequency Mid point x xf cf 50-54 10 52 520 10 55-59 23 57 1311…
Q: The data show the population (in thousands) for a recent year of a sample of cities in South…
A: Given data is 24 19 19 18 62 18 21 24 20 11 22 33 93 13 21 29 13 12 108 45 20 46 108 39 30 51 The 41…
Q: 36. Find the mean for the following frequency tables. a. Grade Frequency 49.5–59.5 2 59.5–69.5 3…
A: Since you have posted multiple questions, as per our guidelines we have provided answer for first…
Q: Determine the Root Mean Square for the * :data in the table below Classes Frequency 4.3-4.39 2 4.4 -…
A: We want to tell you which one is the correct choice
Q: Class Boundaries Classes f <cf 91 – 97 2 94 50 90.5-97.5 84 – 90 87 48 83.5-90.5 77 – 83 10 80 45…
A: From the given table: Class Interval Frequency Cumulative frequency 49-55 3 3 56-62 6 9…
Q: Find the measures of center for following. Data Frequency 50 - 54 55 - 59 60 - 64 11 24 15 65 - 69…
A:
Q: Small_sedan 55 57 57 55 49 Medium Sedan 61 61 56 65 57 64 Large Sedan 70 76 70 72 76 76 Suv 4WD…
A: Consider that, µSS, µMS, µLS, µSUV, and µMV define the mean costs per mile for small sedans,…
Q: Find Mean, Median from formula, and from commulative frequency curve, Mode, Histogram, Frequency…
A: Graphical representation of data are used to visualize the observation of the data set. By…
Q: Approximate the measures of center for following GFDT. Data Frequency 70-74 75 79 80 - 84 4. 8. 85…
A: Introduction: For a grouped data with k classes having class marks xi, class frequency fi (i = 1, 2,…
Q: The annual rainfall was measured in the Western Desert during a period of one year , and the…
A:
Q: Situation For the grouped data tabulated below Frequency Class Interval 118-126 127-135 136-144 9.…
A: To find the mean and median of given data Class Interval Frequency 118-126 3 127-135 5…
Q: The data show the population (in thousands) for a recent year of a sample of cities in South…
A: The number of observations (n) is, 26 The ascending order of the data set is,
Q: 2.3 Measures of the Center of the Data 36. Find the mean for the following frequency tables. a.…
A:
Q: Home Work : 21: The following are the fasting blood glucose levels of 10 chil 56 62 63 65 65 65 65…
A: The given data is as follows: 56 62 63 65 65 65 65 68 70 72 To find mean, median and…
Q: How sensitive to changes in water temperature are coral reefs? To find out, scientists examined data…
A: (a). Obtain the descriptive statistics for the given data: The values of mean and standard deviation…
Q: 75 39.0000| 10 en 40 De 717e N30 (a) Briefly describe the distribution of the daily sales (shape,…
A: As per our guidelines, we are allowed to answer first three sub-parts only. Thanks Given Histogram…
Q: Given the frequency table below, what is the relative frequency of the data value 6? Value…
A: The given frequency distribution is as follows:
Q: decimal places
A:
Q: Find the measures of center for following. Data Frequency 40 44 2 45 49 50 54 4 55 59 4 60 64 4 65 -…
A:
Q: Question No.1 The weight in milligrams of 2538 seeds of the long leef pine were as follows : Class…
A: Given : The weight in milligrams of 2538 seeds of the long leef pine were as follows :Class (weight…
Q: Find the measures of center for following. Frequency 2 Data 50 - 54 55 - 59 60 - 64 65 - 69 70 - 74…
A: Given, Data Frequency 50-54 2 55-59 4 60-64 8 65-69 12 70-74 21 75-79 10 80-84 12…
Q: Draw the histogram of the data and use it to estimate the model weight. 2) calculate mean, median…
A: Given, weight frequency 10 4 15 3 20 23 25 54 30 16 35 9 40 7 45 4 To draw the…
Q: Use the following data to answer the following questions. You can use excel or any app. as…
A: Given that By using excel descriptive statistics
Q: Altman and Bland report the survival times for patients with active hepatitis, half treated with…
A: a).From the given data, it can be observed that there are 12 out of 20 observations are in between…
Q: For the data below construct the frequency distribution table with 5 classes and after that find:…
A: For the given data , following frequency distribution table is constructed :…
Q: (a) The data relating to the length of 30 leaves measured in centimetres is shown below: Length (cm)…
A: We know that, Mean: It is the sum of observations divided the total number observations. Median:…
Q: How expensive is Maui? A newspaper gave the föllowing CUSLS 85 50 66 60 355 55 500 71 42 350 60 50…
A: Given Information: The data represents the costs in dollars per day for a random sample of…
Q: Approximate the measures of center for following GFDT. Data Frequency 40 - 44 45 - 49 2 50 - 54 3 55…
A:
Q: Find the va'ue of mean , mode and median from the data given below : Weight (in kg.) : No. of…
A:
Q: Find the mean for the following data: Years of Experience Number of Employees 1 17 2 6 3 4 4 mean =…
A: We want to find mean of given data.
Q: Find the measures of center for following. Data Frequency 70-74 2. 75-79 4. 80 84 5. 1. 24 85-89 10…
A:


Trending now
This is a popular solution!

Step by step
Solved in 2 steps
