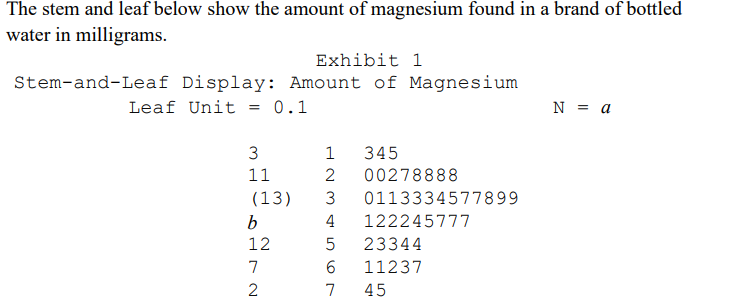
Find the value of a and b What is the largest value in the dataset? What the is median of the data displayed?


Q: The tuition and fees (in thousands of dollars) for the top 14 universities in a recent year are…
A: Given Information: The data represents tuition fees for the top 14 universities. To find the mean,…
Q: What is the range of the distribution? What are the values of * ** and ***? (i) (ii) (iii) What is…
A: Hey there! Thank you for posting the question. Since your question has more than 3 parts, we are…
Q: 4, 4, 5, 6, 9, 9, 9, 12, 13, 14, 14 26. The mean is 27 The median of the distribution is 28. The…
A: Solution: Given data is already in ascending order so use given data n=number of elements=11…
Q: Point Value Number of Tiles 0 2 1 68 2 7 3 8 4 10 5 1 8 2 10 2 Use excel…
A: 1. The steps to construct bar graph using EXCEL is as follows: Enter the data of point value and…
Q: The number of credits being taken by a sample of 13 full-time college students are listed below.…
A:
Q: The tuition and fees (in thousands of dollars) for the top 14 universities in a recent year are…
A: The given dataset is 47, 43, 43, 45, 45, 43, 39, 46, 43, 42, 45, 42, 35, and 43. The mean is the…
Q: 6.) 13, 17, 7, 12, 11, 13, 18, 10, 13, 16 What is the mean? What is the median? What is the mode?…
A: Mean is the average. Mean = ( 13 +17 + 7 + 12 + 11 + 13 + 18 + 10 + 13 + 16 ) / 10 = 130 /…
Q: Report whether the overall distribution of departure time looks normal. Explain your reasonin
A: Given data is appropriate for measures of central tendency. measures of central tendency help you…
Q: 8.) 20, 11, 9, 20, 15, 15 What is the mean? What is the median? What is the mode? What is the range?
A: Find mean, median, mode and range
Q: a) List the data in a stem and leaf diagram b) Find the median c) Find the first and third quartiles
A: Note : as per policy I have calculated 3 SUBPARTS PLZ REPOST FOR REMAINING Here ascending order of…
Q: Find the variance of the set of sample data . 55, 53, 76, 52, 91, 98
A: Sample size = n = 6
Q: questio Delow. (a) Here are the prices (in thousands) for 9 houses for sale in a local neighborhood:…
A: “Since you have asked multiple questions, we will solve the first question for you. If you want any…
Q: For the distribution shown, which letter represents the median? A BC (This is a reading assessment…
A: Solution: The distribution graph is given.
Q: We have provided simple data sets for you to practice the basics of finding measures of center. For…
A: According to the provided information, The data set are 3, 5, and 7. The mean of the data is the sum…
Q: Standardizing If a distribution of raw scores were plotted and then the scores were transformed to z…
A: The value of z-score gives information about the exact locations of the scores relative to all other…
Q: Find the vAriance of the sample data: 191, 215, 76, 262, 93, 163, 162, 268
A: Measure of dispersion measures the spread of the data. Standard deviation indicates how much the…
Q: how to find the find the p value of a data table
A: To find p-value, test statistic and hypothesis must be known.
Q: 5.) 16, 12, 12, 15, 10 What is the mean? What is the median?. What is the mode? What is the range?.
A:
Q: 4.) 8, 11, 8, 16, 7 What is the mean? What is the median? What is the mode?
A: Given number is : 8,11,8,16,7 Arrange the given number in ascending order, 7,8,8,11,16 Total number…
Q: 1) N= {16, 21, 17, 25, 22, 18, 21, 16, 13, 21}. Please use the data set N and calculate a) The Mean,…
A:
Q: 5. The junior high basketball team played ten games. Find the Mean, Median, mode, range, sample…
A: Note: As per the guidelines, in case of multiple questions, answer to first question must be…
Q: Describe a scenario and explain finding the mean of a sampling distribution.
A:
Q: (a) One of Statistics assignment, students are required to do a survey to practice for data…
A: Data are the basic material needed for effective statistical inference and decision-making on a…
Q: What is the arithmetic mean of this data set? mean = What is the median of this data set? median =…
A: We have to calculate the mean, median and mode for the given data. Note : According to our…
Q: Find the (a) mean, (b) median, (c) mode, and (d) midrange for the data and then (e) answer the…
A: Since you have posted a question with multiple sub-parts, we will solve first three subparts for…
Q: Explain sampling, sampling error and sampling distribution with examples. Discuss the importance of…
A: Sampling is a method of data collection used in statistical research and analysis.
Q: The ages of the members of a legislature from a particular state are listed below. Find the mean,…
A: The ages of the members of a legislature from a particular state are listed in the given data .…
Q: them are Republicans. Do the data comprise a sample or a p Do the results represent a statistic or
A: NOTE: As per the guidelines, we are supposed to solve first question only. a). Population is a…
Q: Given the following numbers, 2, 2, 3, 2, 4, 8, 0 Find: a. The mean b. The mode c. The median
A: “Since you have posted a question with multiple sub-parts, we will solve first three sub-parts for…
Q: Find the (a) mean, (b) median, (c) mode, (d) midrange, (e) range, (f) variance, and (g) standard…
A: As per our guidelines we are suppose to answer three sub parts. Given data is ,1, 1, 2 , 3 , 5 ,…
Q: Find the mean, median, mode, range, variance and standard deviation.
A: Given data : [8,6,3,0,0,5,9,2,1,3,7,10,0,3,6]
Q: 9.) 20, 16, 17, 14, 12, 9, 6, 10 What is the mean?. What is the median? What is the mode?. What is…
A:
Q: The tuition and fees (in thousands of dollars) for the top 14 universities in a recent year are…
A:
Q: I NEED HELP 1. Consider a distribution of 10 scores: 2, 5, 8, 1, 9, 3, 0, 3, 9, and a mystery score…
A:
Q: Discuss what the mean of a sampling distribution is and describe how to calculate it using a…
A: Here we want to discuss mean of sampling distribution.
Q: Summarize your sample data, describing the center, spread, and shape in context.] [Note: For shape,…
A:
Q: d the mean, median mode and sample skewness for X = 5, 10,15,20,2
A: The mean is calculated as: The mean is 15. A data set can have multiple modes. If all the data…
Q: Data Set: 3, 7, 11, 13, 16 What is the mean of this data set?
A:
Q: The sorted number of children per day: 20, 22, 29, 37, 49, 56, 64, 70, 70, 87, 92 a) Construct a…
A: a) A box plot is a chart tool used to quickly assess the distributional properties of a sample. The…
Q: a) How many hatchbacks get 23 mpg in the city? Describe the distribution of the dotplot. b) What…
A: Note: As per the guidelines, in case of multiple subparts, answer will be provided for first three…
Q: 4. What is the mode of the data set? 5. Calculate the mean and median INCLUDING the outlier: median…
A:
Q: Fifteen cards are dealt from a standard deck. The number of red cards are counted. Can this…
A: # Given : 15 balls drawn from standard deck and number of red cards counted probability of red…
Q: The cost of you electricity bill for the last five months are as follows: $54, $36, $80, $65, and…
A:
Q: Find the midrange for the given sample data. Listed below are the amounts of time (in months) that…
A: Given data is 11, 21, 29, 35, 49, 57, 61, 61, 71, 76, 85, 93, 132, 142Arrange the data in ascending…
Q: Mean = 64.57 median = 64.50 mode = 64.09 comment on the shape of the distribution. Give reasons…
A: Given that Mean = 64.57 median = 64.50 mode = 64.09
Q: Find the mean, the median, and the mode for the set of scores in the frequency distribution table.…
A:
Q: It's one question. Second image is the sample data
A: Statistical hypothesis testing is an important method in inferential statistics. It is used to test…
Q: Question Joseph wants to estimate the mean number of siblings for each student in his school. He…
A: The sample is the subset of the larger population on which study is conducted,
Q: create a sampling distribution of your data. get the mean, variance, and standard deviation. data:…
A:
Find the value of a and b
What is the largest value in the dataset?
What the is median of the data displayed?
What is the

Step by step
Solved in 2 steps

- In the following table, the lengths of the sides of cubes are given. Determine the volumes of the cubes. Round answers to 2 decimal places where necessary. V=s3 where V=volumes=side 35.Compute the capacity, in liters, of the container shown. Round the answer to the nearest tenth liter. One liter contains 1000 cubic centimeters.In the following table, the diameters and heights of cones are given. Find the volumes of the cones. Round the answers to the nearest whole number. V=0.2618d2h where V=volume , d=diameter , h=height 53.
- Solve these exercises. Where necessary, round the answers to 2 decimal places unless otherwise specified. Find the volume of a prism with a base area of 125 square inches and a height of 8 inches.An ear of corn weighs 1.5 lbs. A case purchased from your local purveyor has 48 ears of corn. After shucking and scraping off the kernels you get 22 lbs of useable corn kernels. According to this information, what is the edible yield percentage for corn?A physician writes a prescription for chlorpheniramine-hydrocodone-pseudoephedrine liquid (Histinex PV) 5 mg q 4-6h. as needed for bronchitis cough. The medication is available with a dosage strength of 1 mg/mL. How much medication do you need to measure out?
- . A container of one dozen large eggs was purchased at a local grocery store. Each egg was measured to determine its diameter (in millimeters) and weight (in grams). The resultsfor the 12 eggs are given in the following table.Diameter(mm)42.2 45.5 47.8 47.4 47.7 43.5 44.4 43.9 46.2 45.9 44.3 44.5Weight(grams)52.8 58.5 60.2 59.0 57.4 54.1 53.8 54.5 56.2 55.8 54.3 56.1Find the following.a. SSxx, SSyy, and SSxyb. Standard deviation of errorsc. SST, SSE, and SSRd. Coefficient of determination5. Describe the mean, standard deviation, and shape of the sampling distribution of the slope b of the simple linear regression model.What does a linear correlation coefficient tell about the relationship between two variables? Within what range can a correlation coefficient assume a value?Study the data below. 1. What is the highest unit cost of the binder in east region? 2. What school supply was/were not sold by Howard? 3. How many pen were sold in the East Region?A health clinic uses a solution of bleach to sterilize petri dishes in which cultures are grown. The sterilization tank contains 60 gal of a solution of 4% ordinary household bleach mixed with pure distilled water. New research indicates that the concentration of bleach should be 6% for complete sterilization. How much of the solution should be drained and replaced with bleach to increase the bleach content to the recommended level? gal?
- The table below is a record of the number of miles driven between stops for gas and the amount of money spent to fill up the gas tank in Avery’s car over several months. Table[U]’s Gas Fill Up Log Miles Driven, x 280280 312312 319319 285285 309309 320320 315315 Cost to Fill up ($$), y 22.0822.08 25.2525.25 25.2125.21 23.7023.70 25.4125.41 26.0726.07 24.5424.54 Copy Data Step 2 of 2 : If Avery needs to drive 297297 miles home from college and leaves with a full tank, how much should she budget to fill up when she gets home? Assume the regression equation is appropriate for prediction. Round your answer to the nearest cent.Your recipe for Coconut Cream Pie yields 12 pies and calls for 9 cups of shredded fresh coconut and 1.5 cups of flour. You need to make 26 pies. a.How many cups of flourshould you use? b.How many coconuts should you purchase? (Use your Approximate Yield & Weight chart to find this answer)How much mulch will you need to cover a rectangular garden that is 20 feet by 30 feet with a 3-inch layer of mulch? Explain. Beckmann, Sybilla. Mathematics for Elementary Teachers with Activities, (p. 521). Pearson Education. Kindle Edition.

