Find the value ofthe line ar correlation coefficient r Find the critical values ofr from table A-6 using x= 0.05 Determine whether there is sufficient evidence to support a claim of a linear correlation Between the two variables.
Find the value ofthe line ar correlation coefficient r Find the critical values ofr from table A-6 using x= 0.05 Determine whether there is sufficient evidence to support a claim of a linear correlation Between the two variables.

MATLAB: An Introduction with Applications
6th Edition
ISBN:9781119256830
Author:Amos Gilat
Publisher:Amos Gilat
Chapter1: Starting With Matlab
Section: Chapter Questions
Problem 1P

Related questions
Question
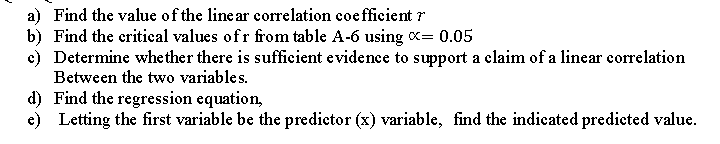
Transcribed Image Text:a) Find the value of the line ar correlation coefficient r
b) Find the critical values ofr from table A-6 using x= 0.05
c) Determine whether there is sufficient evidence to support a claim of a linear correlation
Between the two variables.
d) Find the regression equation,
e) Letting the first variable be the predictor (x) variable, find the indicated predicted value.
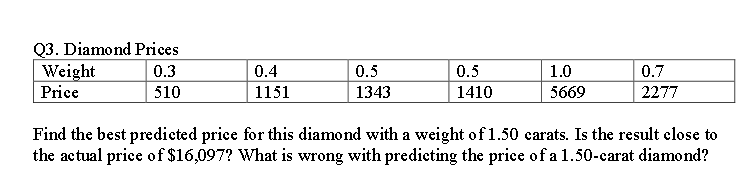
Transcribed Image Text:Q3. Diamond Prices
Weight
Price
0.3
0.4
0.5
0.5
1.0
0.7
510
1151
1343
1410
5669
2277
Find the best predicted price for this diamond with a weight of 1.50 carats. Is the result elose to
the actual price of $16,097? What is wrong with predicting the price of a 1.50-carat diamond?
Expert Solution
This question has been solved!
Explore an expertly crafted, step-by-step solution for a thorough understanding of key concepts.

Step by step
Solved in 3 steps with 2 images

Knowledge Booster


Learn more about
Need a deep-dive on the concept behind this application? Look no further. Learn more about this topic, statistics and related others by exploring similar questions and additional content below.Recommended textbooks for you
MATLAB: An Introduction with Applications
Statistics
ISBN:
9781119256830
Author:
Amos Gilat
Publisher:
John Wiley & Sons Inc

Probability and Statistics for Engineering and th…
Statistics
ISBN:
9781305251809
Author:
Jay L. Devore
Publisher:
Cengage Learning

Statistics for The Behavioral Sciences (MindTap C…
Statistics
ISBN:
9781305504912
Author:
Frederick J Gravetter, Larry B. Wallnau
Publisher:
Cengage Learning
MATLAB: An Introduction with Applications
Statistics
ISBN:
9781119256830
Author:
Amos Gilat
Publisher:
John Wiley & Sons Inc
Probability and Statistics for Engineering and th…
Statistics
ISBN:
9781305251809
Author:
Jay L. Devore
Publisher:
Cengage Learning
Statistics for The Behavioral Sciences (MindTap C…
Statistics
ISBN:
9781305504912
Author:
Frederick J Gravetter, Larry B. Wallnau
Publisher:
Cengage Learning

Elementary Statistics: Picturing the World (7th E…
Statistics
ISBN:
9780134683416
Author:
Ron Larson, Betsy Farber
Publisher:
PEARSON

The Basic Practice of Statistics
Statistics
ISBN:
9781319042578
Author:
David S. Moore, William I. Notz, Michael A. Fligner
Publisher:
W. H. Freeman

Introduction to the Practice of Statistics
Statistics
ISBN:
9781319013387
Author:
David S. Moore, George P. McCabe, Bruce A. Craig
Publisher:
W. H. Freeman