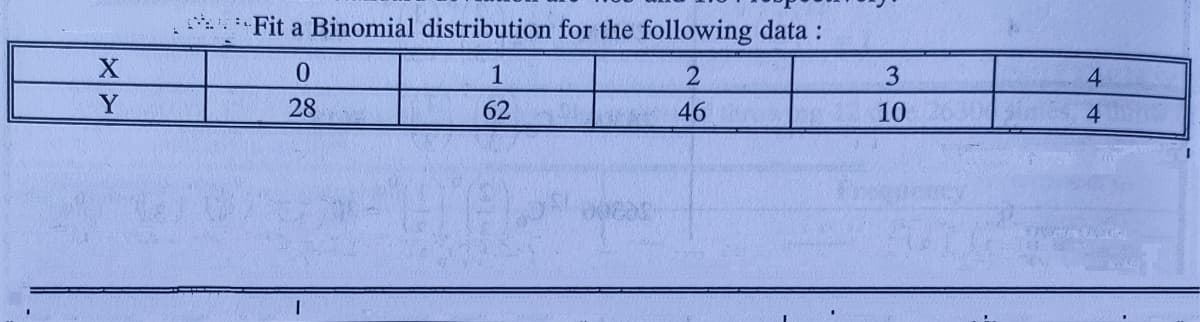
Fit a Binomial distribution for the following data : 1 3. 4. Y 28 62 46 10


Q: Professor Z had the following grade distribution in her class:…
A: Data with regard to a single variable is called as univariate data.One of the measure is measure of…
Q: 6. For the population of scores shown in the frequency distribution table below, the mean is 1 4. 1
A:
Q: ?In a symmetrical distribution, what will be the relationship among the mean, median and mode Mean =…
A:
Q: interpret results. Further state the nature of the distribution of each variable in table No.06…
A: Given, A table of output of statistical suummary for distributions. To find, Further state the…
Q: Q3. Given the following frequency * ?distribution, What is the mean of the data Frequency 22 15 23…
A: Given : X Frequency 22 15 23 160 24 55 25 15 26 46 Now, the table is obtained to…
Q: Given the following data: 247, 113, 4, 29, 89 what is the class size of the distribution?
A: We can find the class size as below
Q: 2. For the data in the table below, find the sum of the absolute deviations for the predicted values…
A: Given observation x y ypred =3.6x-0.4 |y-ypred| 1 3 3.2 0.2 2 7 6.8 0.2 3 9 10.4 1.4 4…
Q: Complete the frequency distribution table and then find the standard deviation Repetition Categories…
A: To complete the frequency distribution table and to find the standard deviation: Complete frequency…
Q: - Place the following scores in a frequency distribution table. Based on the frequencies, what is…
A: Given Solution:
Q: Calculate the coefficient of variation of a distribution with == 25, *f=21 254 and 2.1= 3804 O…
A:
Q: Draw a polygram for the distribution of scores shown below x f 6 2 5 5 4 3 3…
A:
Q: 2000 5 2001 2002 2003 4. 2004 2005 2006 2007 3 4. Find the mean, median, mode, standard deviation…
A:
Q: 12. Below is a data set for number of toys a child owns in a particular neighborhood: ABCDEFG|H…
A: toatal no. of child N=8total number of toyes ∑xi =2+4+4+3+2+3+2+4=24
Q: Calculate the mean and standard deviation for the following distribution : *: 25 35 45 55 65 75 85…
A:
Q: Given a positively skewed distribution with a median of 10 and a mode of 8. Which of the following…
A: Identify the correct option for the given statement. The correct option for the given statement is…
Q: Find the mean, median, and mode for the scores in the following frequency distribution table x f 1…
A: Let us write the frequency table in ascending order. x f 1 5 2 2 3 2 4 2 5 2 6 1…
Q: 4. Find the mean, median, and mode for the scores in the following frequency distribution table: 6 1…
A:
Q: Find the mean, median, and mode for the following frequency distribution. f 3 9. 4 2 7 7 4 8 234 56
A: Solution
Q: Find out the mean, median and mode of the following distribution : Marks Frequency Marks Frequency…
A:
Q: 3. Find each value requested for the distribution of scores in the following table. 4 3 3 4 2 5 1 2…
A: a) The number of values are 5, so n=5 b) The value of ∑ix=1+2+3+4+5=15
Q: 1. Find Mean, Standard Deviation, Third quantile, 21st Percentile, and 87th Percentile for the data…
A: Given: Population size N = 8 Formula Used: Mean X = 1N∑i=1nXi Standard deviation σ = ∑Xi-X2N Third…
Q: Find the mean, median, and mode for the scores in the following frequency distribution table: X f 6…
A: Given that the frequency table to calculate mean, median and mode.MEAN:For discrete series,
Q: Calculate standard deviation for the following distribution: Values: 10 20 30 40 50 60 70 Frequency:…
A: Formula for sample standard deviation of grouped data : s =∑x2f -∑xf2∑f∑f-1
Q: The following three questions use this data set: 7 8 1 6 9 5 11 2 9 12 The mean of this distribution…
A: Measure of central tendency measures the central or average value of a dataset. Measured of…
Q: Find Standard Deviation for the following frequency distribution 10 11 12 13 14 Total 3 12 18 12 48
A:
Q: For a moderately skewed distribution, the arithmetic mean is 100 and the coefficient of variation is…
A:
Q: Find the sample variance s for the following sample data. Round your answer to the nearest…
A: Solution : The given data is 15, 20, 22, 25, 33
Q: Suppose a distribution has Mean=20, Median=10, and SD=15. Then, the coefficient of skewness is, a)…
A: Given: Mean = 20 Median =10 SD = 15
Q: Fit a distribution for t
A: From the given information, No. of heads 0 1 2 3 4 frequency 30 62 46 10 2 150 Let us…
Q: Find the standard deviation for the group of data items. Round to the nearest hundredth. 10, 10, 10,…
A:
Q: For a sample of 12 offenders convicted of weapons violations, the length of prison sentence in…
A: Solution-: Given data: 6,6,2,12,17,48,60,24,20,20,18,15 What is the shape of this given…
Q: Consider the distribution below. Compute for the mean and variance. 10 20 30 40 50 P(x) 5% 5% 25%…
A: Given data is x 0 10 20 30 40 50 P(x) 5% 5% 25% 20% 30% 15%
Q: 3. Find the standard deviation. Data Set: 20, 15, 15, 10, 20 а. 16.0 b. 17.5 C. 5.1 d. 4.2
A: Given: Sample size n = 5 Formula Used: Sample standard deviation = ∑(Xi-X)2n-1 Where X is a sample…
Q: Using the frequency distribution table below, what is the proportion of individuals that scored a 4?…
A: Given data is x f 6 4 5 3 4 7 3 2 2 2 1 2
Q: a. What is the distribution of X? X N( b. What is the median giraffe height? ft. c. What is the…
A: Define the random variable, X : Height of an adult Given that the Height of an adult follows a…
Q: Find the Mean for the following frequency distribution table: 10 – 20 20 – 30 30 – 40 40 – 50 50 –…
A:
Q: 10. Which of the following statistics describes the spread of a sample? A. Size, n B. Mean, x C.…
A:
Q: Find the mean of the distribution shown below. 3. 7 P(X) 0.21 0.07 0.58 0.14 O 6.23 0.25 O 24
A: To find the mean of the distribution
Q: Find the mean, median, mode (if applicable), range, and standard deviation. Round to 2 place when…
A: We can answer first question as per the honor policy. Please resubmit other questions one by one as…
Q: 3. The following is the frequency distribution of the scores of students in a Mathematics Test.…
A:
Q: For a binomial distribution, Mean the distribution. 7, and Variance = 11. Comment on
A:
Q: Find the mean, median, and mode for the scores in the following frequency distribution table: 8 1 7…
A: We know that, Mean : Mean of the set of observations is their sum divided by the number of…
Q: 3. Find each value requested for the distribution of scores in the following table. a. n b. ΣΧ c.…
A:
Q: 5. The following values are the number of customers a restaurant served for lunch on ten consecutive…
A: Here, x (x-x) (x-x)2 46 -14.4 207.36 49 -11.4 129.96 51 -9.4 88.36 60 -0.4 0.16 63 2.6…
Q: Fit a Poisson distribution to the following set of data : No. of Death : 1 4 Frequency : 142 156 69…
A: Given :
Q: Q2. Find the mean deviation, standard deviation and variance for the following frequency…
A:
Q: Identify the shape of the following distributions: 1. 2. 3. 4. 5.
A: Given that
Q: What the variance for the following sample of n = 3 scores? Scores: 1, 4, 7 06 15
A:
Q: Describe the distribution given the following stem and leaf plot: 이 25 1|33 2|0 1 3| 11 4| 27…
A: 0 | 2 5 1 | 3 3 2 | 0 1 3 | 1 1 4 | 2 7
Q: The following data are given to you to find out whether the distribution is platykurtic N= 100, Efd,…
A: Concentration of all the values around the central value of the given data is known as measures of…

Step by step
Solved in 4 steps
