Five males with an X-linked genetic disorder have one child each. The random variable x is the number of children among the five who inherit the X-linked genetic disorder. Determine whether a probability distribution is given. If a probability distribution is given, find its mean and standard deviation. If a probability distribution is not given, identify the requirements that are not satisfied. P(x) O 0.027 0.153 2 0.320 0,320 4 0.153 0.027 1 3 5 Does the table show a probability distribution? Select all that apply. O A. Yes, the table shows a probability distribution. B. No, not every probability is between 0 and 1 inclusive. C. No, the sum of all the probabilities is not equal to 1. O D. No, the random variable x's number values are not associated with probabilities. O E. No, the random variable x is categorical instead of numerical. Find the mean of the random variable x. Select the correct choice below and, if necessary, fill in the answer box to complete your choice. OA. child(ren) (Round to one decimal place as needed.) O B. The table does not show a probability distribution. Find the standard deviation of the random variable x. Select the correct choice below and, if necessary, fill in the answer box to complete your choice.
Five males with an X-linked genetic disorder have one child each. The random variable x is the number of children among the five who inherit the X-linked genetic disorder. Determine whether a probability distribution is given. If a probability distribution is given, find its mean and standard deviation. If a probability distribution is not given, identify the requirements that are not satisfied. P(x) O 0.027 0.153 2 0.320 0,320 4 0.153 0.027 1 3 5 Does the table show a probability distribution? Select all that apply. O A. Yes, the table shows a probability distribution. B. No, not every probability is between 0 and 1 inclusive. C. No, the sum of all the probabilities is not equal to 1. O D. No, the random variable x's number values are not associated with probabilities. O E. No, the random variable x is categorical instead of numerical. Find the mean of the random variable x. Select the correct choice below and, if necessary, fill in the answer box to complete your choice. OA. child(ren) (Round to one decimal place as needed.) O B. The table does not show a probability distribution. Find the standard deviation of the random variable x. Select the correct choice below and, if necessary, fill in the answer box to complete your choice.

MATLAB: An Introduction with Applications
6th Edition
ISBN:9781119256830
Author:Amos Gilat
Publisher:Amos Gilat
Chapter1: Starting With Matlab
Section: Chapter Questions
Problem 1P

Related questions

Question
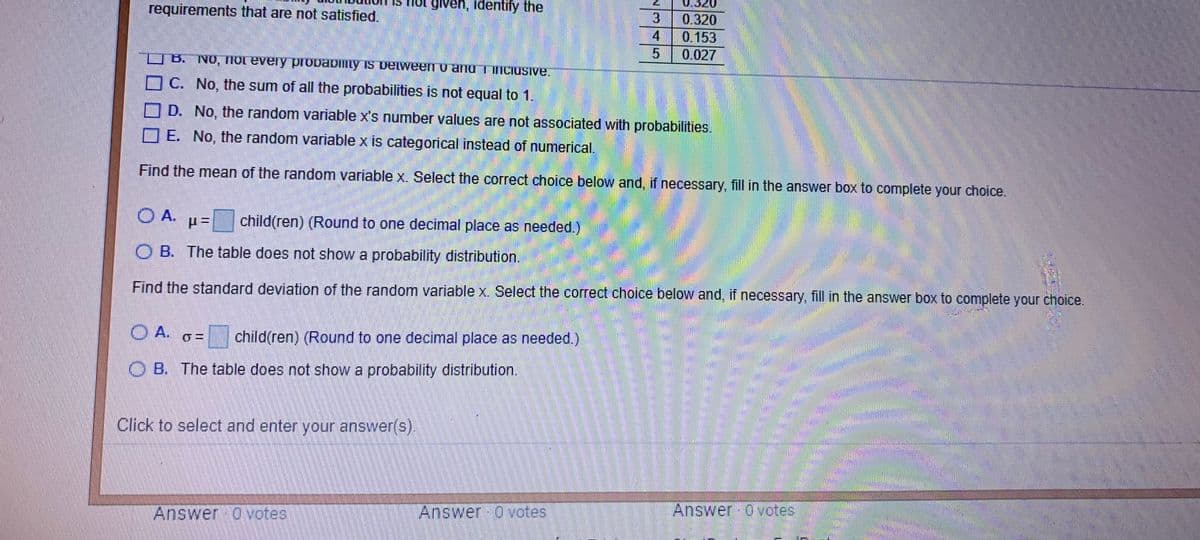
Transcribed Image Text:requirements that are not satisfied.
not given, identify the
0.320
0.320
4
0.153
O B. NO, TOL every probabimty IS Delween anu TinCiuSive.
0.027
C. No, the sum of all the probabilities is not equal to 1.
D. No, the random variable x's number values are not associated with probabilities.
O E. No, the random variable x is categorical instead of numerical.
Find the mean of the random variable x. Select the correct choice below and, if necessary, fill in the answer box to complete your choice.
O A.
child(ren) (Round to one decimal place as needed.)
O B. The table does not show a probability distribution.
Find the standard deviation of the random variable x. Select the correct choice below and, if necessary, fill in the answer box to complete your choice.
O A.
child(ren) (Round to one decimal place as needed.)
O B. The table does not show a probability distribution.
Click to select and enter your answer(s).
Answer 0votes
Answer 0votes
Answer O votes
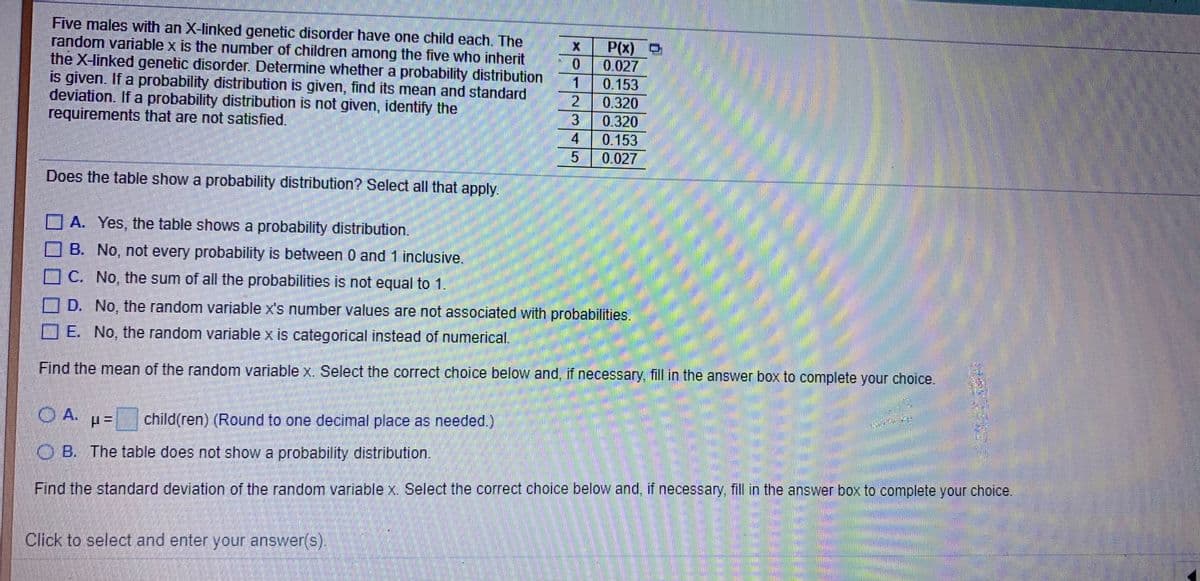
Transcribed Image Text:Five males with an X-linked genetic disorder have one child each. The
random variable x is the number of children among the five who inherit
the X-linked genetic disorder. Determine whether a probability distribution
is given. If a probability distribution is given, find its mean and standard
deviation. If a probability distribution is not given, identify the
requirements that are not satisfied.
P(x) O
0.027
0.153
21
0.320
3
0.320
0.153
0.027
Does the table show a probability distribution? Select all that apply.
A. Yes, the table shows a probability distribution.
B. No, not every probability is between 0 and 1 inclusive.
OC. No, the sum of all the probabilities is not equal to 1.
D. No, the random variable x's number values are not associated with probabilities.
D E. No, the random variable x is categorical instead of numerical.
Find the mean of the random variable x. Select the correct choice below and, if necessary, fill in the answer box to complete your choice.
OA.
child(ren) (Round to one decimal place as needed.)
O B. The table does not show a probability distribution.
Find the standard deviation of the random variable x. Select the correct choice below and, if necessary, fill in the answer box to complete your choice.
Click to select and enter your answer(s).
45
Expert Solution
This question has been solved!
Explore an expertly crafted, step-by-step solution for a thorough understanding of key concepts.

This is a popular solution!

Trending now
This is a popular solution!

Step by step
Solved in 3 steps

Knowledge Booster


Learn more about
Need a deep-dive on the concept behind this application? Look no further. Learn more about this topic, statistics and related others by exploring similar questions and additional content below.Recommended textbooks for you
MATLAB: An Introduction with Applications
Statistics
ISBN:
9781119256830
Author:
Amos Gilat
Publisher:
John Wiley & Sons Inc

Probability and Statistics for Engineering and th…
Statistics
ISBN:
9781305251809
Author:
Jay L. Devore
Publisher:
Cengage Learning

Statistics for The Behavioral Sciences (MindTap C…
Statistics
ISBN:
9781305504912
Author:
Frederick J Gravetter, Larry B. Wallnau
Publisher:
Cengage Learning
MATLAB: An Introduction with Applications
Statistics
ISBN:
9781119256830
Author:
Amos Gilat
Publisher:
John Wiley & Sons Inc
Probability and Statistics for Engineering and th…
Statistics
ISBN:
9781305251809
Author:
Jay L. Devore
Publisher:
Cengage Learning
Statistics for The Behavioral Sciences (MindTap C…
Statistics
ISBN:
9781305504912
Author:
Frederick J Gravetter, Larry B. Wallnau
Publisher:
Cengage Learning

Elementary Statistics: Picturing the World (7th E…
Statistics
ISBN:
9780134683416
Author:
Ron Larson, Betsy Farber
Publisher:
PEARSON

The Basic Practice of Statistics
Statistics
ISBN:
9781319042578
Author:
David S. Moore, William I. Notz, Michael A. Fligner
Publisher:
W. H. Freeman

Introduction to the Practice of Statistics
Statistics
ISBN:
9781319013387
Author:
David S. Moore, George P. McCabe, Bruce A. Craig
Publisher:
W. H. Freeman