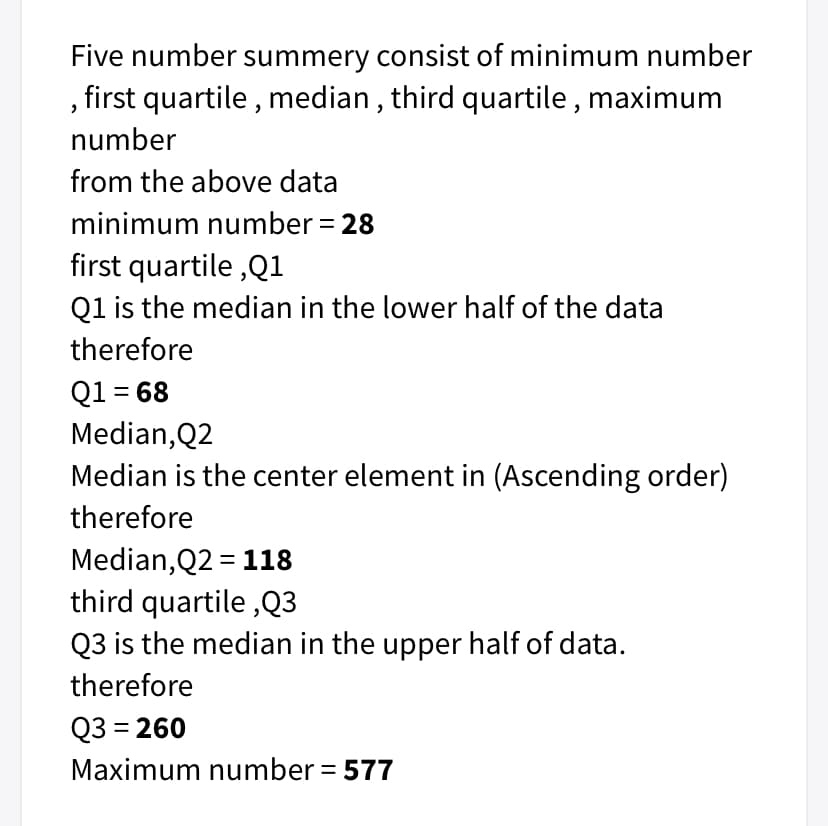
Five number summery consist of minimum number , first quartile , median , third quartile , maximum number from the above data minimum number = 28 first quartile ,Q1 Q1 is the median in the lower half of the data therefore Q1 = 68 Median,Q2 Median is the center element in (Ascending order) therefore Median, Q2 = 118 third quartile ,Q3 Q3 is the median in the upper half of data. therefore Q3 = 260 Maximum number = 577


Q: study of one of the colleges, the total number of stude was (2000 students), and a sample of (60…
A: The process of selecting a sample from a population is called sampling. In sampling, a…
Q: Two groups of experimental animals are given two brands of feed supplement and the following weight…
A: The following data is given, Group 1: 260, 204, 105, 275, 210, 100, 110, 143, 170, 189 Group 2: 65,…
Q: A travel agency wants to determine if the length ofcustomers’ phone calls can be adequately modeled…
A: A travel agency wants to determine if the length of customer’s phone calls can be adequately modeled…
Q: Human resource managers face the business problem of assessing the impact of factors on full-time…
A: Let us define total worldwide revenues as X1, FT voluntary Turnover and Total FT job openings as Y.…
Q: Engineers are interested in comparing the mean hydrogen production rates per day for three different…
A: a) The variable under study is the mean hydrogen production rates per day. The statistical…
Q: A doctor in Baltimore wants to know whether the average life span for heart disease patients at four…
A: Follow the steps below to get the ANOVA Table in excel: 1) Import the data in the excel and then…
Q: Here is a sample of amounts of weight change (kg) of college students in their freshman year: 14, 2,…
A: Given data : 40 , 23 , 11 , 11 , -4 , -2 , 11 , -2 , -6 , 44
Q: Lecture(12.13): Researchers were investigating anxiety in first year college students.According to…
A: Given information: Going for a walk/ doing physical activity Listening to music/ watching a…
Q: Here is a sample of amounts of weight change (kg) of college students in their freshman year. 14, 3,…
A:
Q: Here is a sample of amounts of weight change (kg) of college students in their freshman year: 10,…
A: We have to find the mean of all bootstrap samples and sort them We now obtain from our list of…
Q: In 2016, the New York Times reported that the average American spent 50 minutes per day on Facebook,…
A: From the given information, AverageFacebook=50 Average reading, exercising, or actually socializing…
Q: Here is a sample of amounts of weight change (kg) of college students in their freshman year: 13, 5,…
A: Using the ten bootstrap samples. to determine 80% confidence interval estimate of mean weight change…
Q: 5. An experiment was conducted to determine whether a test designed to identify a certain form of…
A: Given Data : Sample 1 = Staff Sample 2 = Trainees Sample 3 = Students 7876807986 8069758172…
Q: A cognitive psychologist conducted a study on the perception of speech sounds in two types of…
A: A t-test is a type of inferential statistic used to determine if there is a significant difference…
Q: 7. A new drug study was conducted by a drug company. In the study, 10 people were chosen at random…
A: 7.a). The plots are drawn used Microsoft Excel. The steps for plotting are- 1. Type the data in an…
Q: A personnel office is gathering data regarding working conditions. Employees are given a list of…
A: Circle chart vs Pareto chart:In circle chart, each pie represents the proportions of categories. The…
Q: ly joined North Valley Real Estate and was assigned twenty homes to market and show. When he was…
A: Agent price Marty 206424 Rose 346150 Carter 372360 Peterson 310622 Carter 496100…
Q: The population of ages at inauguration of all U.S. Presidents who had professions in the military is…
A: The histogram is a plot which is used to depict the distribution of data . By observing the…
Q: The mayor of a town has proposed a plan for the construction of an adjoining bridge. A political…
A: Given : n = 900 p^ = 0.48 p = 0.51
Q: Professor X wants to compare a new approach to his teaching style. 24 students are matched…
A: Introduction: It is given that 24 students are paired based on their prior background and academic…
Q: random sample of 10 baseball players is taken to determine the characteristics of player's salaries.…
A: Given n=10 Total number 640
Q: ) What is the probability that a randomly chosen male respondent or his partner has blue eyes? b)…
A:
Q: You are an education researcher interested in studying if race or ethnicity affects the severity of…
A: You are an education researcher interested in studying if race or ethnicity affects the severity of…
Q: our place of employment is trying to determine whether to allow its employees to work from home for…
A: Note: As per the multiple questions rule, we are answering first question for you. Kindly repost the…
Q: Here is a sample of amounts of weight change (kg) of college students in their freshman year: 10, 7,…
A: First we find the mean of all bootstrap samples and sort them in ascending order The 80% confidence…
Q: Here is a sample of amounts of weight change (kg) of college students in their freshman year: 15, 7,…
A: From the given information, the bootstrap samples are, Means for each sample…
Q: 3. A professor of statistics teaches one class through conventional method and the other class with…
A: Given data:Significance levelα=0.01conventional method:sample sizen1=15sample meanx1=84sample…
Q: The data "sea_pets_samp" is a simple random sample of 100 cases from the dataset "seattlepets" from…
A:
Q: A researcher selected a sample of 268 former student athletes from a list of graduates of a large…
A: Given : A researcher selected a sample of 268 former student athletes from a list of graduates of a…
Q: In 2016, the New York Times reported that the average American spent 50 minutes per day on Facebook,…
A: Let x¯1 and x¯2 be the sample mena time spent on Facebook and Other activities respectively. x¯1=50…
Q: IUS 2020 reached a sample of 2,401 Internet users and 384 non-Internet users at the national level…
A: Introduction - mean=sum of all observations total number of observations Standard deviation…
Q: A large number of insurance records are to be examined to develop a model for predicting fraudulent…
A: Given Information: A large number of insurance records are to be examined to develop a model for…
Q: Here is a sample of amounts of weight change (kg) of college students in their freshman year: 12, 3,…
A:
Q: Here is a sample of amounts of weight change (kg) of college students in their freshman year: 14, 3,…
A: (a)
Q: IUS 2020 reached a sample of 2,401 Internet users and 384 non-Internet users at the national level…
A: Introduction - mean=sum of all observations total number of observations Standard deviation…
Q: What type of analysis would be appropriate to address the researcher’s question and why did you make…
A: Type A Type B 20 10 10 11 11 4 23 12 7 1 Mean (x¯1) and standard deviation (sd or s1 )…
Q: Here is a sample of amounts of weight change (kg) of college students in their freshman year: 10, 9,…
A: We have the ten bootstrap samples and their sample means as below:
Q: Information regarding the ACT scores of randomly selected samples of students in three different…
A: The following information has been provided: Management Finance Accounting 28 22 29 26…
Q: Here is a sample of amounts of weight change (kg) of college students in their freshman…
A: Tabulate data as shown below: Now, for each sample, average must be computed as shown below Sample…
Q: Here is a sample of amounts of weight change (kg) of college students in their freshman year: 15, 5,…
A: Consider the table below- Here, α=0.2
Q: (5) A certain educational institute has 15 centers located at different places in a city. There are…
A: i) Cluster sampling. When n sampling units are selected from N population units with simple random…
Q: A biologist wants to determine if different temperatures (15oC, 25oC, or 35oC) and amounts of…
A: To find: What type of sampling is described in this study?
Q: Here is a sample of amounts of weight change(kg) of college students in their freshman year:…
A: a) The formula for the mean is,
Q: A private lake sells boating memberships and currently has 600 members. During the application…
A: The sample size requirement for a Chi-square test for independence and goodness of fit is that the…
Q: Camille for her part wants to assess the impact of an awareness campaign aimed at reducing the…
A: Let μ1 denotes the population average amount of of food waste per household with campaign, and μ2…
Q: A cat-lover claims that cats are just as smart as dogs. In order to back this claim up with some…
A: It is given that, the 90% confident that the true difference in the proportion of all dogs and all…
Q: 6. Advantages and disadvantages of the related-samples design Disadvantages of using a related…
A: The objective is to identify the disadvantage of using a related sample versus using two independent…
Q: How do you find Median for even number of observations under ungrouped method? a. Arrange the data…
A:
Q: Here is a sample of amounts of weight change (kg) of college students in their freshman year: 12, 3,…
A:
Q: type of error you could be making
A:
Outlier identification
Any data value less than ________or greater than_______ is to be considered an outlier.


Trending now
This is a popular solution!

Step by step
Solved in 4 steps with 4 images

- A cell phone company offers 6 different voice packages and 8 different data packages. Of those, 3 packages include both voice and data. How many ways are there to choose either voice or data, but not both?Imagine a database from the Gallogly College of Engineering that contained the starting salariesfor a sample of Spring 2021 graduating engineers. Recreate the following table. At theintersections of the table, fill out what happens to the sample statistic (in the row) when everysalary is altered by the specified amount (in the column). You’re welcome to use actual data totest your intuition, but data aren’t necessary – the answers in the intersections should begeneric.The manufacturer of an MP3 player wanted to know whether a 10% reduction in price is enough to increase the sales of its product. To investigate, the owner randomly selected 8 outlets and sold the MP3 player at the reduced price. At 7 randomly selected outlets, the MP3 player was sold at the regular price. Reported below is the number of units sold last month at the regular and reduced prices at the randomly selected outlets. Regular (7 outlets) - 138, 127, 129, 114, 114, 126, 98 Reduced (8 outlets) - 122, 135, 151, 133, 113, 129, 134, 133 At the 0.050 significance level, can the manufacturer conclude that the price reduction resulted in an increase in sales? Hint: for the calculations, assume the reduced price as the first sample. Compute the pooled estimate of the variance (round to 3 decimal places) Compute the test statistic (round to 2 decimal places)
- A 7th grade science teacher would like to know if spending more time doing class experiments will help his students perform better on tests. In a day, he teaches 4 periods of science, so for his 1st and 3th period classes, he taught as he normally does with mostly lectures and occasional class experiments. For his 2nd and 4th period classes, he did a class experiment every day with minimal lectures. There were n = 25 different students in each of his classes. He then wanted to compare the exam averages between his classes to see if student performance was significantly different. Which of the following statistical tests should he use? z-Test one-sample t-Test independent sample t-test dependent sample t-testA 7th grade science teacher would like to know if spending more time doing class experiments will help his students perform better on tests. In a day, he teaches 4 periods of science, so for his 1st and 3th period classes, he taught as he normally does with mostly lectures and occasional class experiments. For his 2nd and 4th period classes, he did a class experiment every day with minimal lectures. There were n = 25 different students in each of his classes. He then wanted to compare the exam averages between his classes to see if student performance was significantly different. Which of the following statistical tests should he use? z-Test independent sample t-test dependent sample t-test17- How do you find Median for even number of observations under ungrouped method? a. Arrange the data in ascending order and multiply middle two numbers b. Arrange the data in ascending order and find the difference of middle two numbers c. Arrange the data in ascending order and add middle two numbers d. Arrange the data in ascending order and take the average of middle two numbers
- A personnel office is gathering data regarding working conditions. Employees are given a list of five conditions that they might want to see improved. They are asked to select the one item that is most critical to them. Which type of graph, circle graph or Pareto chart, would be the most useful for displaying the results of the survey? Why? Pareto chart, because it shows the items in order of importance to employees. Circle chart, because it shows the items in order of importance to employees. Circle chart, because it shows the total number of important issues to employees. Pareto chart, because it shows the total number of important issues to employees.A 7th grade science teacher would like to know if spending more time doing class experiments will help his students preform better on tests. In a day, he teaches 4 periods of science, so for his 1st and 3rd period classes, he taught as he normally does with mostly lectures and occassional class experiments. For his 2nd and 4th period classes, he did a class experiment everyday with minimal lectures. There were n=25 different students in each of his classes. He then wanted to compare the exam averages between his classes to see if student preformance was significantly different. Which statistical tests should he use?A psychology instructor at a large university teaches statistics. There are 22 students in the class, and he has broken them into two groups. Each group has a different graduate assistant who is responsible for running separate breakout lecture and lab sections of the course. One graduate assistant (GA) has lots of experience teaching, while the other has more limited experience. The instructor wants to check for comparable learning across the two GAs, hoping students receive similar experiences (i.e., to find no difference). The data below are the scores (out of 100) of the students on the first midterm. Use it to test whether there is a difference between the groups. Group 1 (less experienced GA) Group 2 (more experienced GA) 60 70 65 85 69 72 58 83 57 81 59 69 52 65 72 75 70 79 65 71 75 80 Q: List the steps to obtaining all relevant statistical output in SPSS. List the steps to…
- A psychologist at the Hospital was asked to determine whether there was any clear difference in the length of stay (in days) of patients with different categories of diagnosis. The hospital was looking for ways to reduce costs and free up some more beds so that they could treat more patients from the community. They chose three diagnostic categories that they thought were possibly staying the longest and selected the 4 more recent admissions from each of these diagnostic categories: affective disorders, cognitive disorders, and drug-related disorders. The results are presented in Table 3 below. Using an alpha = .05 and showing all the steps of hypothesis testing, is there a significant difference in length of stay among diagnosistic categories?The file MidCity Download MidCitycontains data on 128 recent sales in Mid City. For each sale, the file shows the neighborhood (1, 2, or 3) in which the house is located, the number of offers made on the house, the square footage, whether the house is made primarily of brick, the number of bathrooms, the number of bedrooms, and the selling price. Neighborhoods 1 and 2 are more traditional neighborhoods, whereas neighborhood 3 is a newer, more prestigious neighborhood. Home Nbhd Offers Sq Ft Brick Bedrooms Bathrooms Price 1 2 2 1790 No 2 2 228600 2 2 3 2030 No 4 2 228400 3 2 1 1740 No 3 2 229600 4 2 3 1980 No 3 2 189400 5 2 3 2130 No 3 3 239600 6 1 2 1780 No 3 2 229200 7 3 3 1830 Yes 3 3 303200 8 3 2 2160 No 4 2 301400 9 2 3 2110 No 4 2 238400 10 2 3 1730 No 3 3 208000 11 2 3 2030 Yes 3 2 265000 12 2 2 1870 Yes 2 2 246000 13 1 4 1910 No 3 2 205200 14 1 5 2150 Yes 3 3 252600 15 3 4 2590 No 4 3 353600 16 3 1 1780 No 4 2 291600 17 2 4 2190 Yes 3 3…A consumer researcher gave consumers a sample shampoo. After using the shampoo, each consumer used an interval-level scale to rate his or her satisfaction with it. Scores could range from 0 to 100, with higher scores indicating greater satisfaction. Consumers didn’t know each other and were randomly assigned to three groups: (1) receive a store brand of shampoo in a bottle clearly labeled as such, (2) receive a premium brand of shampoo in the premium brand’s bottle, or (3) receive a store brand of shampoo in the premium brand’s bottle. Here are the collected data: Store brand, store bottle Premium brand, premium bottle Store brand, premium bottle 70 85 85 65 90 80 65 95 90 60 90 85 M = 65s = 4.08 M = 90s = 4.08 M = 85s = 4.08 SSbetween = 1400 c. What is the decision rule?d. Calculate the test
