A doctor in Baltimore wants to know whether the average life span for heart disease patients at four hospitals in the city differ. The data below represents the life span, in years, of heart disease patients from each hospital. Perform an ANOVA test with a 7% level of significance to test whether the average life span of heart disease patients in Baltimore differs depending on the hospital that treats them Life Span of Patients Treated at Hospital 1: 12.4, 17.5, 20, 0.1, 1.7, 21.5, 10.8,72 20.4, 11.5, 8.3, 3.7, 3.1, 3.7, 9.7, 13.2, 11.6, 14.8, 1.2, 5.6, 8.8, 6.2, 7.7, 8.5, 19.5, 2.4, 3.1, 8.3, 8.3, 26.3, 6.3, 16.1 Life Span of Patients Treated at Hospital 2: 9.4, 3.2, 6.4, 8.4, 18.7, 5.5, 21.7, 21.4, 6.5, 6.4, 14.2, 4.3, 16.6, 8.1, 7.5, 3.8, 19.9, 1.1, 1.6, 16.2, 16.6, 4, 11.9, 27.7, 24.9, 0.5, 9.1, 14.7, 8.4, 14.9, 18.1 Life Span of Patients Treated at Hospital 3: 35, 13.7, 3.8, 14.2, 5.7, 15.4, 21.6, 0, 11.9, 7.1, 6.4, 5.4, 17.9, 18.6, 14.3, 4, 10.5, 2.4, 2.5, 6.9, 7.8, 8.4, 11.3 Life Span of Patients Treated at Hospital 4: 9.1, 0.1, 8.9, 0.8, 10.9, 14.5, 6.5, 19.1, 2.9, 11.2, 9.4, 21.7, 19.8, 6.3, 8.6, 20.4, 8.4, 4, 13.1, 20.9, 13.8, 19.5, 16.6, 2.7, 28.5, 19, 13.7, 8.8, 5.3, 16, 8.4, 0.2, 8.9, 4.7, 7.7 Step 1: State the null and alternative hypotheses. Ho: P1 = P2 = H3 = Ha Ha: At least one mean isn't equal to the other means V Part 2 of 4 Step 2: Assuming the null hypothesis is true, determine the features of the distribution of test statistics. We will use a(n) F v distribution with numerator degrees of freedom %3D 117 d fpetween and denominator degrees of freedom dfwithin = 3 Part 3 of 4
A doctor in Baltimore wants to know whether the average life span for heart disease patients at four hospitals in the city differ. The data below represents the life span, in years, of heart disease patients from each hospital. Perform an ANOVA test with a 7% level of significance to test whether the average life span of heart disease patients in Baltimore differs depending on the hospital that treats them Life Span of Patients Treated at Hospital 1: 12.4, 17.5, 20, 0.1, 1.7, 21.5, 10.8,72 20.4, 11.5, 8.3, 3.7, 3.1, 3.7, 9.7, 13.2, 11.6, 14.8, 1.2, 5.6, 8.8, 6.2, 7.7, 8.5, 19.5, 2.4, 3.1, 8.3, 8.3, 26.3, 6.3, 16.1 Life Span of Patients Treated at Hospital 2: 9.4, 3.2, 6.4, 8.4, 18.7, 5.5, 21.7, 21.4, 6.5, 6.4, 14.2, 4.3, 16.6, 8.1, 7.5, 3.8, 19.9, 1.1, 1.6, 16.2, 16.6, 4, 11.9, 27.7, 24.9, 0.5, 9.1, 14.7, 8.4, 14.9, 18.1 Life Span of Patients Treated at Hospital 3: 35, 13.7, 3.8, 14.2, 5.7, 15.4, 21.6, 0, 11.9, 7.1, 6.4, 5.4, 17.9, 18.6, 14.3, 4, 10.5, 2.4, 2.5, 6.9, 7.8, 8.4, 11.3 Life Span of Patients Treated at Hospital 4: 9.1, 0.1, 8.9, 0.8, 10.9, 14.5, 6.5, 19.1, 2.9, 11.2, 9.4, 21.7, 19.8, 6.3, 8.6, 20.4, 8.4, 4, 13.1, 20.9, 13.8, 19.5, 16.6, 2.7, 28.5, 19, 13.7, 8.8, 5.3, 16, 8.4, 0.2, 8.9, 4.7, 7.7 Step 1: State the null and alternative hypotheses. Ho: P1 = P2 = H3 = Ha Ha: At least one mean isn't equal to the other means V Part 2 of 4 Step 2: Assuming the null hypothesis is true, determine the features of the distribution of test statistics. We will use a(n) F v distribution with numerator degrees of freedom %3D 117 d fpetween and denominator degrees of freedom dfwithin = 3 Part 3 of 4

MATLAB: An Introduction with Applications
6th Edition
ISBN:9781119256830
Author:Amos Gilat
Publisher:Amos Gilat
Chapter1: Starting With Matlab
Section: Chapter Questions
Problem 1P

Related questions
Question
Step 3
Transcribed Image Text:thin
Part 3 of 4
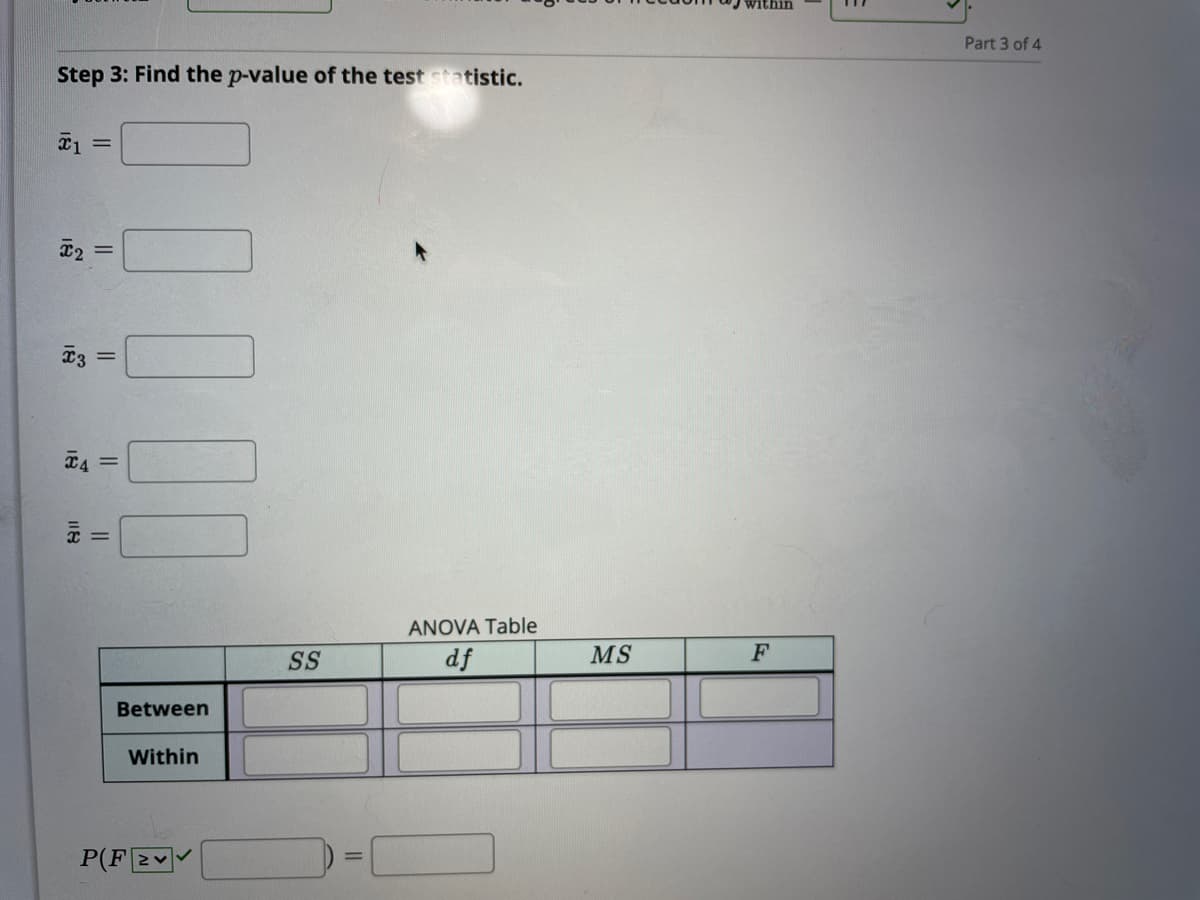
Step 3: Find the p-value of the test statistic.
4 =
ANOVA Table
SS
df
MS
F
Between
Within
P(F 2v
%3D
||
Transcribed Image Text:* myopenmath.com/assess2/?cid=101459&aid=7240159#/skip/2
politi
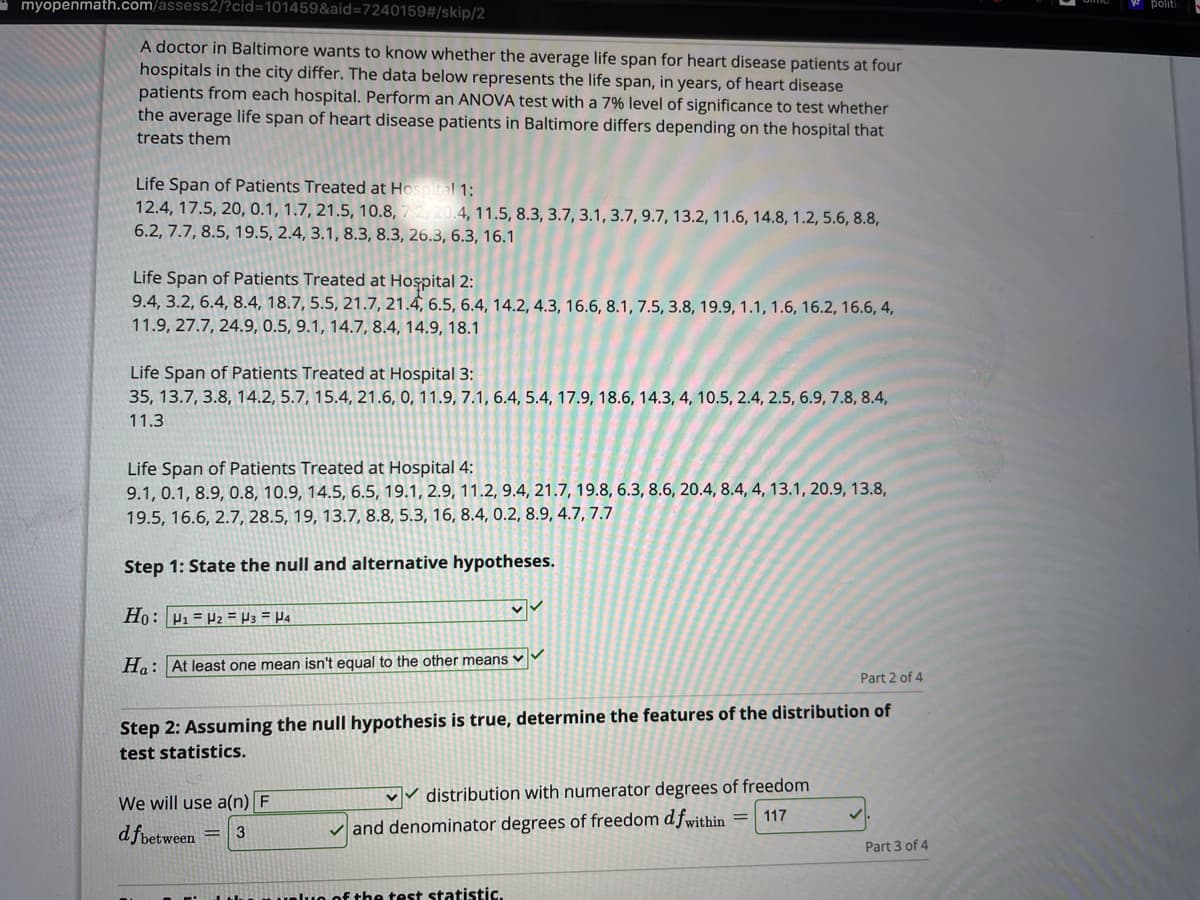
A doctor in Baltimore wants to know whether the average life span for heart disease patients at four
hospitals in the city differ. The data below represents the life span, in years, of heart disease
patients from each hospital. Perform an ANOVA test with a 7% level of significance to test whether
the average life span of heart disease patients in Baltimore differs depending on the hospital that
treats them
Life Span of Patients Treated at Hospital 1:
12.4, 17.5, 20, 0.1, 1.7, 21.5, 10.8, 72, 20.4, 11.5, 8.3, 3.7, 3.1, 3.7, 9.7, 13.2, 11.6, 14.8, 1.2, 5.6, 8.8,
6.2, 7.7, 8.5, 19.5, 2.4, 3.1, 8.3, 8.3, 26.3, 6.3, 16.1
Life Span of Patients Treated at Hospital 2:
9.4, 3.2, 6.4, 8.4, 18.7, 5.5, 21.7, 21.4, 6.5, 6.4, 14.2, 4.3, 16.6, 8.1, 7.5, 3.8, 19.9, 1.1, 1.6, 16.2, 16.6, 4,
11.9, 27.7, 24.9, 0.5, 9.1, 14.7, 8.4, 14.9, 18.1
Life Span of Patients Treated at Hospital 3:
35, 13.7, 3.8, 14.2, 5.7, 15.4, 21.6, 0, 11.9, 7.1, 6.4, 5.4, 17.9, 18.6, 14.3, 4, 10.5, 2.4, 2.5, 6.9, 7.8, 8.4,
11.3
Life Span of Patients Treated at Hospital 4:
9.1, 0.1, 8.9, 0.8, 10.9, 14.5, 6.5, 19.1, 2.9, 11.2, 9.4, 21.7, 19.8, 6.3, 8.6, 20.4, 8.4, 4, 13.1, 20.9, 13.8,
19.5, 16.6, 2.7, 28.5, 19, 13.7, 8.8, 5.3, 16, 8.4, 0.2, 8.9, 4.7, 7.7
Step 1: State the null and alternative hypotheses.
Ho: P1 = P2 = µ3 = P4
Ha: At least one mean isn't equal to the other means v
Part 2 of 4
Step 2: Assuming the null hypothesis is true, determine the features of the distribution of
test statistics.
We will use a(n) F
v distribution with numerator degrees of freedom
117
dfpetween =
and denominator degrees of freedom d fwithin
3
Part 3 of 4
nluo of the test statistic.
Expert Solution
This question has been solved!
Explore an expertly crafted, step-by-step solution for a thorough understanding of key concepts.

Step by step
Solved in 2 steps with 4 images

Knowledge Booster


Learn more about
Need a deep-dive on the concept behind this application? Look no further. Learn more about this topic, statistics and related others by exploring similar questions and additional content below.Recommended textbooks for you
MATLAB: An Introduction with Applications
Statistics
ISBN:
9781119256830
Author:
Amos Gilat
Publisher:
John Wiley & Sons Inc

Probability and Statistics for Engineering and th…
Statistics
ISBN:
9781305251809
Author:
Jay L. Devore
Publisher:
Cengage Learning

Statistics for The Behavioral Sciences (MindTap C…
Statistics
ISBN:
9781305504912
Author:
Frederick J Gravetter, Larry B. Wallnau
Publisher:
Cengage Learning
MATLAB: An Introduction with Applications
Statistics
ISBN:
9781119256830
Author:
Amos Gilat
Publisher:
John Wiley & Sons Inc
Probability and Statistics for Engineering and th…
Statistics
ISBN:
9781305251809
Author:
Jay L. Devore
Publisher:
Cengage Learning
Statistics for The Behavioral Sciences (MindTap C…
Statistics
ISBN:
9781305504912
Author:
Frederick J Gravetter, Larry B. Wallnau
Publisher:
Cengage Learning

Elementary Statistics: Picturing the World (7th E…
Statistics
ISBN:
9780134683416
Author:
Ron Larson, Betsy Farber
Publisher:
PEARSON

The Basic Practice of Statistics
Statistics
ISBN:
9781319042578
Author:
David S. Moore, William I. Notz, Michael A. Fligner
Publisher:
W. H. Freeman

Introduction to the Practice of Statistics
Statistics
ISBN:
9781319013387
Author:
David S. Moore, George P. McCabe, Bruce A. Craig
Publisher:
W. H. Freeman