To compare customer satisfaction levels of two competing ice cream companies, 8 customers of Company 1 and 5 customers of Company 2 ware randomly selected and were asked to rate their ice creams on a five-point scale, with 1 being least satisfied and 5 most satisfied. The survey results are summarized in the following table:


Contingency Table
A contingency table can be defined as the visual representation of the relationship between two or more categorical variables that can be evaluated and registered. It is a categorical version of the scatterplot, which is used to investigate the linear relationship between two variables. A contingency table is indeed a type of frequency distribution table that displays two variables at the same time.
Binomial Distribution
Binomial is an algebraic expression of the sum or the difference of two terms. Before knowing about binomial distribution, we must know about the binomial theorem.
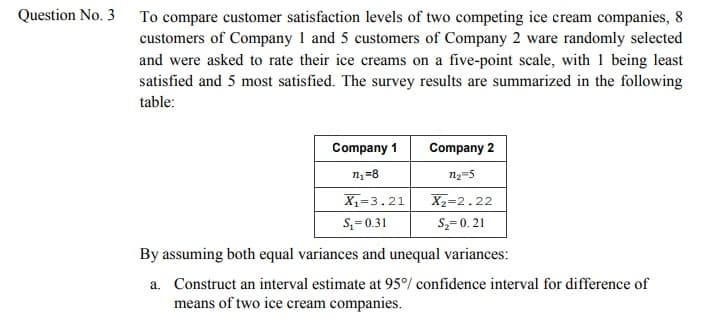
To compare customer satisfaction levels of two competing ice cream companies, 8
customers of Company 1 and 5 customers of Company 2 ware randomly selected
and were asked to rate their ice creams on a five-point scale, with 1 being least
satisfied and 5 most satisfied. The survey results are summarized in the following
table:
Company 1 Company 2
?1=8 ?2=5
?1
̅̅̅̅=3.21 ?2
̅̅̅̅=2.22
?1= 0.31 ?2= 0. 21
By assuming both equal variances and unequal variances:
a. Construct an
means of two ice cream companies


Trending now
This is a popular solution!

Step by step
Solved in 2 steps


