
MATLAB: An Introduction with Applications
6th Edition
ISBN: 9781119256830
Author: Amos Gilat
Publisher: John Wiley & Sons Inc
expand_more
expand_more
format_list_bulleted
Related questions
Concept explainers
Question
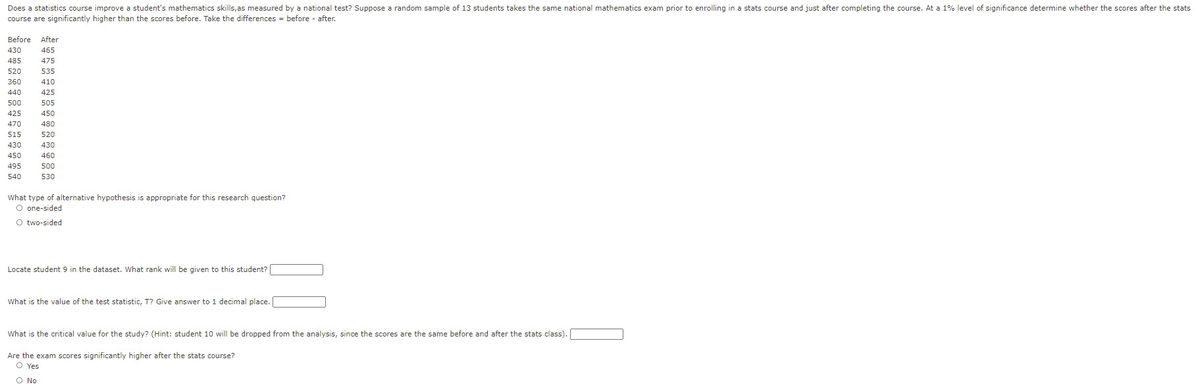

Transcribed Image Text:Does a statistics course improve a student's mathematics skills,as measured by a national test? Suppose a random sample of 13 students takes the same national mathematics exam prior to enrolling in a stats course and just after completing the course. At a 1% level of significance determine whether the scores after the stats
course are significantly higher than the scores before. Take the differences = before - after.
Before After
430
465
485
475
520
535
360
410
440
425
500
505
425
450
470
480
515
520
430
430
450
460
495
500
540
530
What type of alternative hypothesis is appropriate for this research question?
O one-sided
O two-sided
Locate student 9 in the dataset. What rank will be given to this student?
What is the value of the test statistic, T? Give answer to 1 decimal place.
What is the critical value for the study? (Hint: student 10 will be dropped from the analysis, since the scores are the same before and after the stats class).
Are the exam scores significantly higher after the stats course?
O Yes
O No
Expert Solution
This question has been solved!
Explore an expertly crafted, step-by-step solution for a thorough understanding of key concepts.

This is a popular solution

Trending nowThis is a popular solution!

Step by stepSolved in 3 steps

Knowledge Booster


Learn more about
Need a deep-dive on the concept behind this application? Look no further. Learn more about this topic, statistics and related others by exploring similar questions and additional content below.Similar questions
- Secretary of State Roxana Tillerson is worried about malpractice at the 4 processing centers for Green Cards in the country. Green Card applications are given a grade g on a scale 0-100. They are assigned randomly to different centers and thus Tillerson expects all centers to have similar mean scores. She collects the data in the table. #applications 9360 67.27 15.29 1 9870 66.74 14.64 7020 66.94 15.14 3 5040 67.02 14.84 4 rows x 3 columns At this point she just wants to decide whether or not to initiate a deeper investigation into malpractice at all sites. Does she have sufficient evidence for this, at 6% significance? SSTT number (rtol=0.01, atol=0.0001) SSE number (rtol=0.01, atol=0.0001) F. number (rtol=0.01, atol=0.0001) P-val number (rtol=0.01, atol=0.0001) O (a) No, she cannot make a conclusion O (b) Yes, she has enough evidence Select the key assumptions in the test you used. O (a) The populations are independent and therefore their covariances are zero. O (b) All sample sizes…arrow_forwardI need help with something regarding this problem. The National Sleep Foundation recommends that adults aged 18 to 64 get an average of 8 hours of sleep per night. A survey of sleep hours was taken during a Statistics class. The data is listed below: 4, 5, 5, 5, 5.5, 6, 6, 6, 6, 7, 7, 7, 7, 7, 7, 7, 8, 8, 8, 8, 9, 9, 9, 10, 10 Do we have enough evidence at the 0.05 significance level to say that statistics students tend to get less sleep than the recommended average of 8 hours per night? How would I get the degrees of freedom?arrow_forwardPlease answer all the questions in literal barrow_forward
- Cris Turlock owns and manages a small business in San Francisco, California. The business provides breakfast and brunch food, via carts parked along sidewalks, to people in the business district of the city. Being an experienced businessperson, Cris provides incentives for the salespeople operating the food carts. This year, she plans to offer monetary bonuses to her salespeople based on their individual mean daily sales. Her first task is to see if there is a significant difference in the mean daily sales among the different salespeople. She chooses a "sample" of days for each salesperson and records the sales for each day. She then runs a one-way, independent-samples ANOVA test to determine whether or not she can conclude that at least one salesperson's performances is significantly different from the others. (Otherwise, she'll split the bonuses evenly among all the salespeople.) In her ANOVA, the "groups" are the different salespeople, and the variable of interest is the daily sales…arrow_forwardThe college physical education department offered an advanced first aid course last summer. The scores on the comprehensive final exam were normally distributed, and the z-scores for some of the students are shown below. Robert 1.24 Juan 1.66 Haley −1.84 Joel 0.00 Jan −0.84 Linda 1.68 Which of these students scored above the mean? (Select all that apply.) Which of these students scored on the mean? (Select all that apply.) Which of these students scored below the mean? (Select all that apply.) If the mean score was μ = 140 with standard deviation σ = 15, what was the final exam score for each student?arrow_forwardA study was conducted to examine the impact of speaking in public on college students. A class of 15 statistics students participated in the study. At the beginning of a lecture the students recorded their systolic blood pressure. During the lecture the instructor called on each student to stand and answer questions about topics in the lecture. After speaking the students once again recorded their blood pressure. The resulting values are given below along with summary statistics. before 100 123 128 125 136 108 130 113 105 136 146 138 108 149 132 after 141 142 146 136 144 111 132 114 103 133 140 130 100 133 113 difference -41 -19 -18 -11 -8 -3 -2 -1 2 3 6 8 8 16 19 before after difference mean 125.1 127.9 -2.733 st dev 15.26 15.45 15.23 Does this information indicate that blood pressure increased because of speaking? Conduct an appropriate hypothesis test and show appropriate steps. Let μ1 mean systolic blood pressure before speaking in public, and μ2 mean…arrow_forward
- In a city with three high schools, all the ninth graders took a Standardized Test, with these results: High School Mean score on test Number of ninth graders Glenwood 76 272 Central City 93 325 Lincoln High 73 180 The city's PR manager, who never took statistics, claimed the mean score of all ninth graders in the city was 80.7 . Of course, that is incorrect. What is the mean score for all ninth graders in the city? Round to one decimal place.mean of all ninth grader's scores =arrow_forwardIn a city with three high schools, all the ninth graders took a Standardized Test, with these results: High School Mean Test Score Number of ninth graders (Frequency) Glenwood 81 284 Central 95 323 Lincoln 69 154 The city's PR manager, who never took statistics, claimed the mean score of all ninth graders in the city was the average of 81, 95, and 69, which is 81.7. Of course, that is incorrect. What is the mean score for all ninth graders in the city? Round to one decimal place. mean of all ninth grader's scores =arrow_forwardIn a city with three high schools, all the ninth graders took a Standardized Test, with these results: High School Mean Test Score Number of ninth graders (Frequency) Glenwood 79 279 Central 94 349 Lincoln 70 161 The city's PR manager, who never took statistics, claimed the mean score of all ninth graders in the city was the average of 79, 94, and 70, which is 81. Of course, that is incorrect. What is the mean score for all ninth graders in the city? Round to one decimal place. Mean of all ninth grader's Scores =arrow_forward
- The table below shows the scores of a group of students on a 10-point quiz. Test Score Frequency 3 4 4 2 5 2 6 3 7 1 8 4 9 2 10 1 The mean score on this test is: IncorrectThe median score on this test is: Show your workarrow_forwardA study was conducted about the number of milesarrow_forwardPrActicE the legalization of marijuana. Among the Democratic voters surveyed, 158 of the 200 people aged 18-29 and 210 of the 300 people aged 50-64 supported legalizing marijuana. Is this difference significant at a = .05? A random sample of individuals in one town was surveyed about their position onarrow_forward
arrow_back_ios
arrow_forward_ios
Recommended textbooks for you
- MATLAB: An Introduction with ApplicationsStatisticsISBN:9781119256830Author:Amos GilatPublisher:John Wiley & Sons Inc
 Probability and Statistics for Engineering and th...StatisticsISBN:9781305251809Author:Jay L. DevorePublisher:Cengage Learning
 Statistics for The Behavioral Sciences (MindTap C...StatisticsISBN:9781305504912Author:Frederick J Gravetter, Larry B. WallnauPublisher:Cengage Learning
  Elementary Statistics: Picturing the World (7th E...StatisticsISBN:9780134683416Author:Ron Larson, Betsy FarberPublisher:PEARSON
 The Basic Practice of StatisticsStatisticsISBN:9781319042578Author:David S. Moore, William I. Notz, Michael A. FlignerPublisher:W. H. Freeman
 Introduction to the Practice of StatisticsStatisticsISBN:9781319013387Author:David S. Moore, George P. McCabe, Bruce A. CraigPublisher:W. H. Freeman
MATLAB: An Introduction with Applications
Statistics
ISBN:9781119256830
Author:Amos Gilat
Publisher:John Wiley & Sons Inc
Probability and Statistics for Engineering and th...
Statistics
ISBN:9781305251809
Author:Jay L. Devore
Publisher:Cengage Learning
Statistics for The Behavioral Sciences (MindTap C...
Statistics
ISBN:9781305504912
Author:Frederick J Gravetter, Larry B. Wallnau
Publisher:Cengage Learning
Elementary Statistics: Picturing the World (7th E...
Statistics
ISBN:9780134683416
Author:Ron Larson, Betsy Farber
Publisher:PEARSON
The Basic Practice of Statistics
Statistics
ISBN:9781319042578
Author:David S. Moore, William I. Notz, Michael A. Fligner
Publisher:W. H. Freeman
Introduction to the Practice of Statistics
Statistics
ISBN:9781319013387
Author:David S. Moore, George P. McCabe, Bruce A. Craig
Publisher:W. H. Freeman