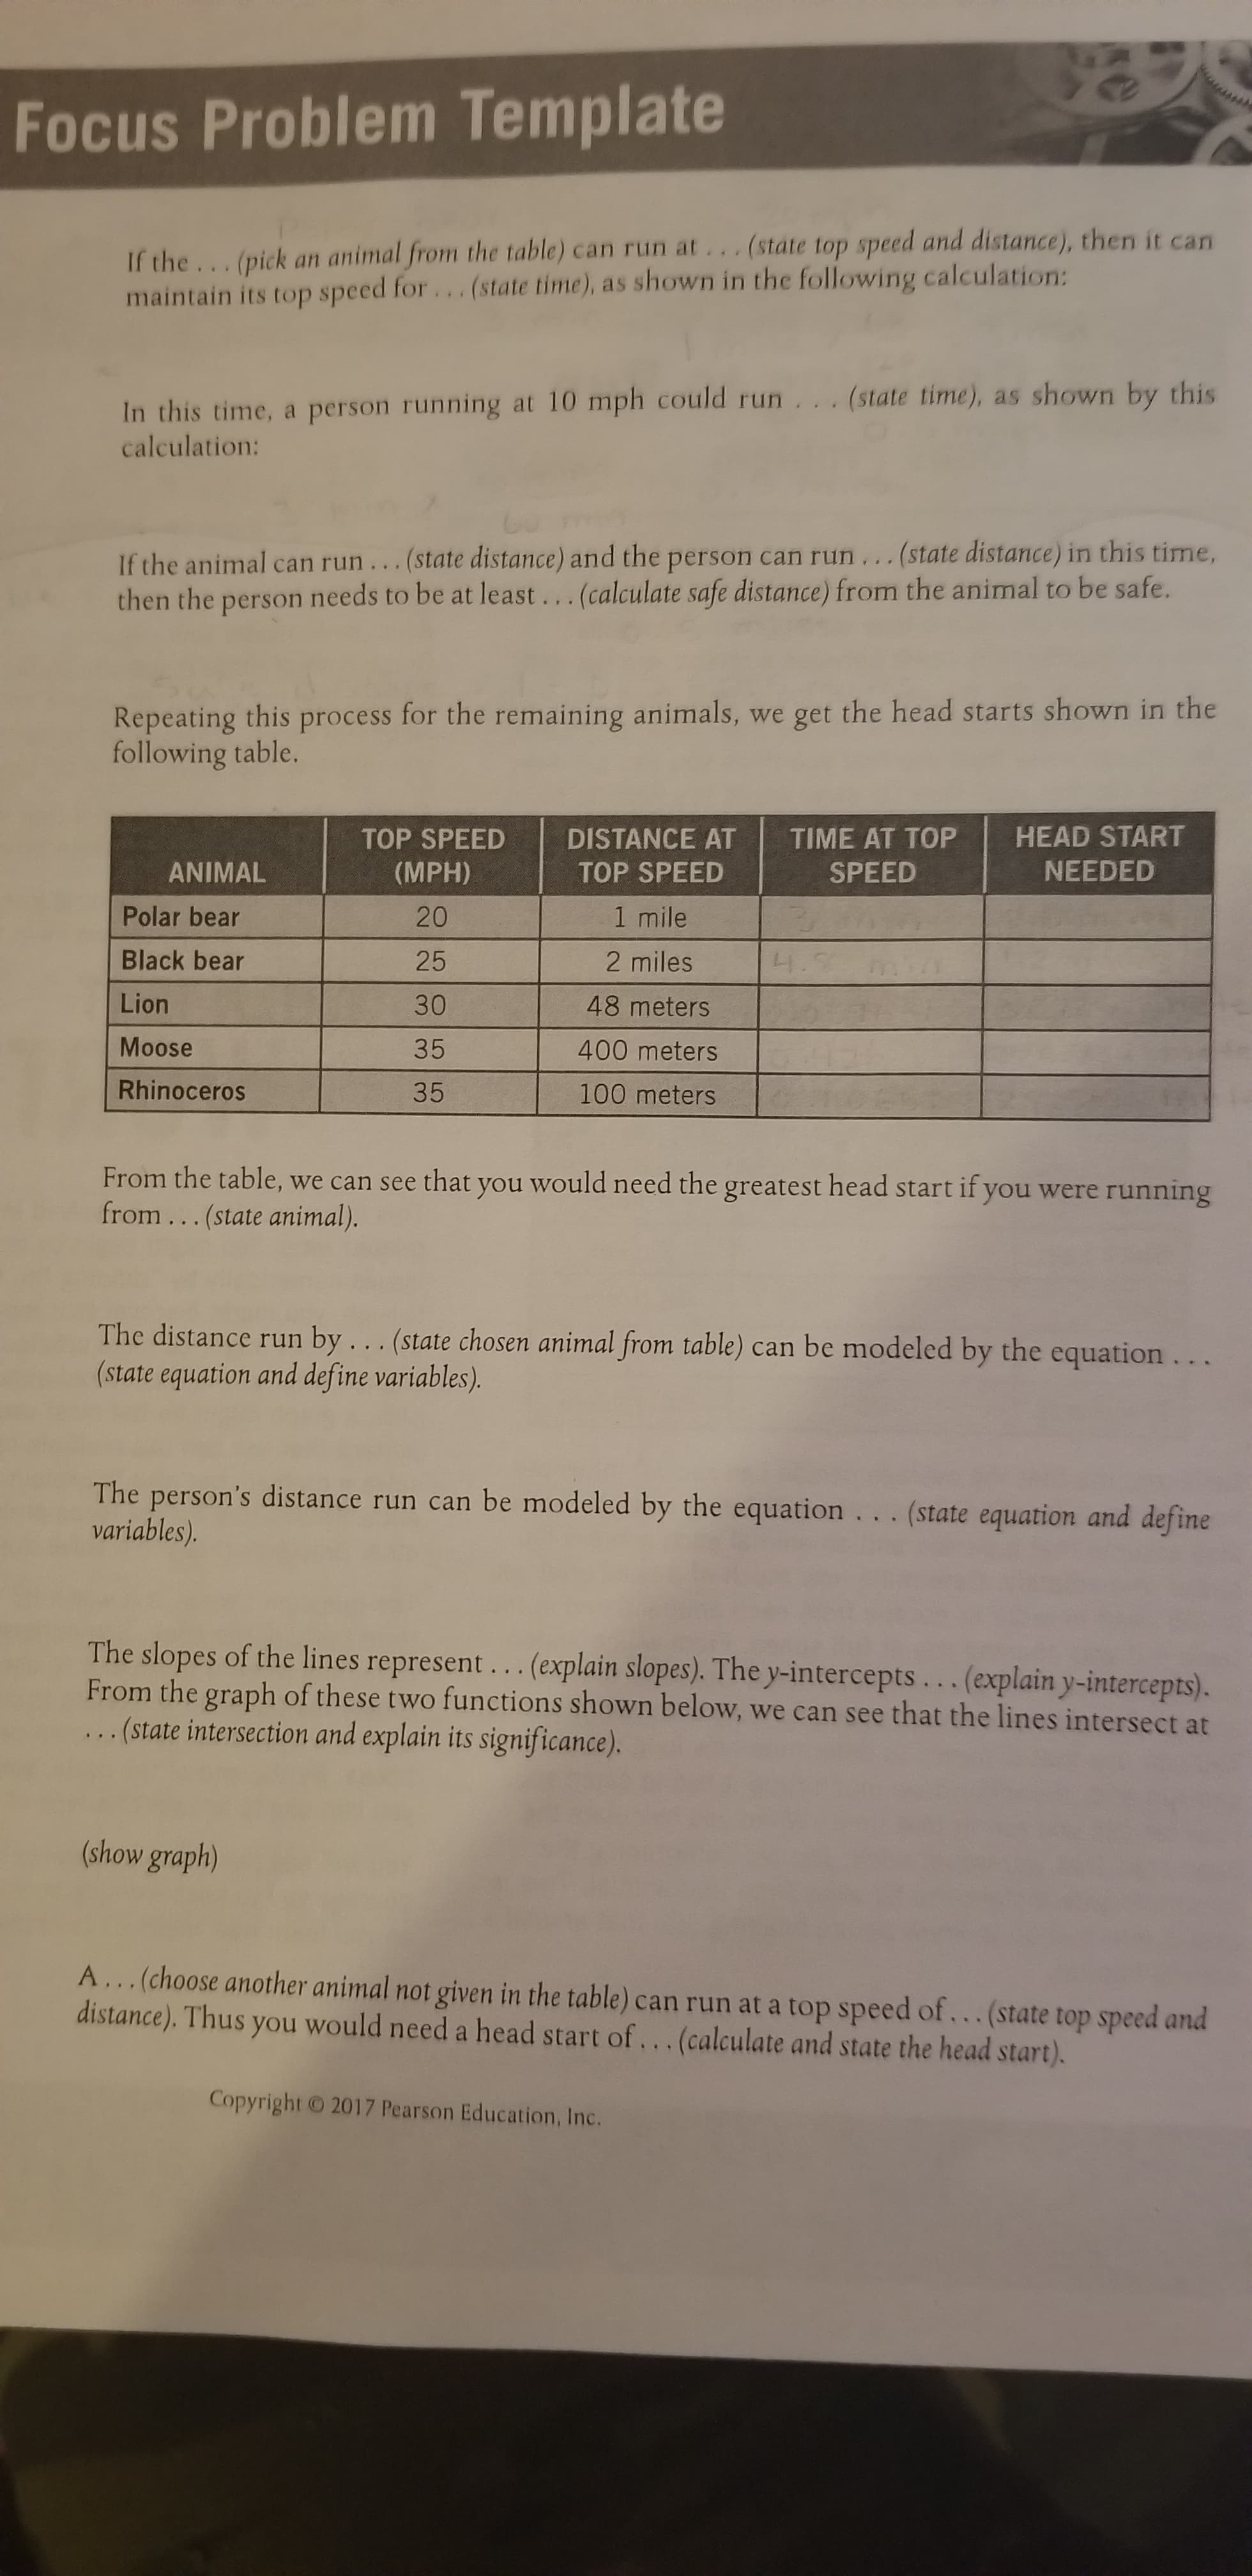
Focus Problem Template If the...(pick an animal from the table) can run at... (state top speed and distance), then it can maintain its top speed for... (state time), as shown in the following calculation: In this time, a person running at 10 mph could run... (state time), as shown by this calculation: If the animal can run...(state distance) and the person can run...(state distance) in this time, then the person needs to be at least... (calculate safe distance) from the animal to be safe. Repeating this process for the remaining animals, we get the head starts shown in the following table. HEAD START DISTANCE AT TOP SPEED TIME AT TOP NEEDED ANIMAL (MPH) TOP SPEED SPEED 1 mile Polar bear 20 Black bear 25 2 miles 4.9 Lion 30 48 meters Moose 35 400 meters Rhinoceros 35 100 meters From the table, we can see that you would need the greatest head start if you were running from... (state animal). The distance run by... (state chosen animal from table) can be modeled by the equation... (state equation and define variables). The person's distance run can be modeled by the equation.. . (state equation and define variables). The slopes of the lines represent... (explain slopes). The y-intercepts... (explain y-intercepts). From the graph of these two functions shown below, we can see that the lines intersect at ... (state intersection and explain its significance). (show graph) A...(choose another animal not given in the table) can run at a top speed of...(state top speed and distance). Thus you would need a head start of...(calculate and state the head start). Copyright 2017 Pearson Education, Inc.


Correlation
Correlation defines a relationship between two independent variables. It tells the degree to which variables move in relation to each other. When two sets of data are related to each other, there is a correlation between them.
Linear Correlation
A correlation is used to determine the relationships between numerical and categorical variables. In other words, it is an indicator of how things are connected to one another. The correlation analysis is the study of how variables are related.
Regression Analysis
Regression analysis is a statistical method in which it estimates the relationship between a dependent variable and one or more independent variable. In simple terms dependent variable is called as outcome variable and independent variable is called as predictors. Regression analysis is one of the methods to find the trends in data. The independent variable used in Regression analysis is named Predictor variable. It offers data of an associated dependent variable regarding a particular outcome.
Time at top speed/head start needed for the rhinoceros? With equation.


Trending now
This is a popular solution!

Step by step
Solved in 4 steps with 4 images


