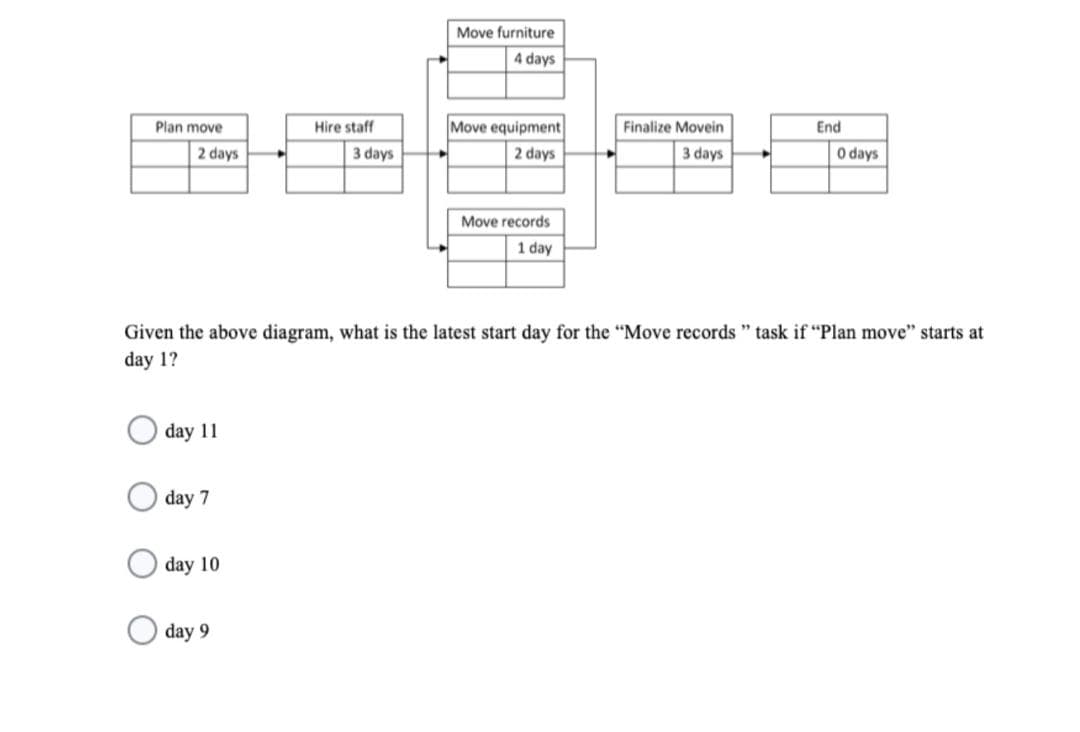
Given the above diagram, what is the latest start day for the "Move records " task if "Plan move" starts at day 1? day 11 day 7 day 10 day 9


Q: Page |1 MAFS.6.RP.1.1 This table shows the number of books, by type, checked out from the school…
A: Solve
Q: Problem No. 20: Jose, Dario, Alfred, Linda, Maria and Rosa graduated from the same university with…
A: according to question, jose , Dario , Alfred , Linda , Maria and Rosa graduated from the same…
Q: Questions: 1. Assuming that the number of flyers continues to increase in the same manner, make a…
A: Given that on the first day, you were able to produce 50 flyers another day again you were able to…
Q: lem, answer
A: given: number of enrollment for 6 days total enrollment = 79+40+50+43+40+20 = 272 we need to…
Q: Task 7 is done by Select an answer Task 8 is done by Select an answer starting at time starting at…
A: From the given system we have to find the processor and starting time of a particular task.
Q: Write a textual presentation of Table 1.
A: Frequency distribution is a way of organizing data.
Q: Please provide a diagram of a circuit with the following input/output table: out 1 1 1 1 1 1 1 1 1 1…
A:
Q: Draw an exploded diagram of the office organizer.
A: Given: Let us determine the exploded diagram of the given office organizer.
Q: The human resources director for a commercial real estate company received the following numbers of…
A:
Q: Need help for question 1. And question 2.
A: Since you have asked multiple question, we will solve the first question for you. If youwant any…
Q: SSS SAS ASA AAS Not enough information
A:
Q: Task 6 is done b Select an answer tarting at time Processor 1 Processor 2 Task 8 is done by otiect…
A: Processor 1: T3, T6, T9 Task T6 is done by processor 1 starting at time 8 hours.
Q: From a list of 30 sites 4 will be selected for a visit over next Monday, Wednesday and Friday. How…
A: We have 30 sites out of which we need to select 4 sites to visit on Monday, Wednesday, and Friday.…
Q: What would be the frequency for the class 27 - 30?
A: In the given data, the observation lies between 27-30 is 27,28,29,30.
Q: In 1835, Samuel Morse, a professor of art at New York University, devised a code that could be…
A: Given that the code can be upto a combinatior of 5 symbols. For each symbol we have 2 choices. If…
Q: Create phaee line diagram for
A: C) In this part we need to draw the phase line by using the sign chart for y'.
Q: Define appropriations , and identify what implications are associated with with the timing (start…
A: Appropriations is a statistical concept which has usage in accounting.
Q: Problem 2. Ann, Bert, Caren, Dan, Eli, Farrah, Gab and Heni is assigned as a group in a certain…
A: The no. of members in the group created for a certain class activity is 8. Group leader is Ann. Ann…
Q: A = NO4
A: We have given a matrix : A=3-22-220204 We have to find the eigen values and eigen vectors of the…
Q: (c) Repeat part (b) for a community of 1500 people. You will need to use a calculator to compute…
A: Given Information: USA today reported that U.S birth rate is about 16 per 1000 people, and the death…
Q: How would you explain any patternyou see?
A: Given: Pattern
Q: Venn diagrams can be used to solve problems that result from surveying groups of people. Example 1:…
A: Solution
Q: Identify the element in Figure 3 that could be misleading to the reader.
A: Given information: A bar-graph for the barnacle recruiters in square centimeters is given.
Q: A dentist was making note of her upcoming appointments with different aged patients and the reasons…
A: Given data, P(Appointment is for broken teeth and is not with patient under 18)=?
Q: 1 Evaluate logs without using calculator 25
A:
Q: On the right is a contingency table for active Naval military personnel, cross-classified by marital…
A:
Q: Level 2 A BC А В С Give it time, Stay on the line. 7 Code: -C x B = %3D
A: As we stay on the line we will get- C =8 And B = 9
Q: I also need help with questions 2, 3, 4, and 5.
A: Hey, since there are multiple questions posted, we will answer first question. If you want any…
Q: Need help with question 4
A:
Q: show
A: From the following table given, a. The probability that student earned an A is, From the data , The…
Q: help on part c
A: We have, f(x)=(2x+7a)(x-a)2; where a>0 and a=constant.
Q: Refer to Figure 2-5. The lowest score in the class was X= _________ and the number of people with…
A: Histogram is a graphical representation of a frequency distribution with attributes (X) as the base…
Q: QUESTION 2 The Management of an establishment intends to hire a car for a 5-day working week. Three…
A:
Q: Listed below are six eight-letter words. Rank the words in order of the number of unique ways to…
A:
Q: day 6) A class of 20 students has 220 subsets. Use a calculator to determine how long (to the…
A: Since you have asked multiple questions, we will solve the first question for you. If you want any…
Q: Consider the following figure. A a 5 4 B 3.
A:
Q: The human resources director for a commercial real estate company received the following numbers of…
A: Since, you have posted multiple questions, we have answered only first question as per our…
Q: QUESTION 4 Draw Venn diagram for (A N B) Attach File Browse My Computer
A: To draw a venn diagram
Q: Give this two tables an appropriate title and analyze/interpret the results of each table. (5…
A: Given information: The frequency table for the variable Mothers age type is given.
Q: for mail verification.
A: Explanation of the solution is given below...
Q: January 1, 1992, was a Monday, what day of the week will January 1, 2002 and March 1, 2004 be?
A: It is known that 1992 is leap year and 2004 is a leap year, 1996 is a leap year and 2000 leap year.…
Q: Example:Drowa timeline diagram for the following activities
A: Given to draw a time line diagram for the following activity. There are total of seven activities…
Q: Graph a bar chart and a pie chart BY HAND, and upload them to this question using the "File Upload"…
A: The frequency for each category is obtained by counting the number of responses corresponding to…
Q: The human resources director for a commercial real estate company received the following numbers of…
A:
Q: Given the following schedule information and baseline budget, develop status reports for periods 1 –…
A:
Q: 14. Covert into degrees 18
A:
Q: Find the number of dots in diagram 1 diagram 11 diagram n
A:
Q: Question 10 Evaluate: Jevdx.
A:
Q: Use the venn diagram to compare and contrast between direct and indirect contacts. 1| Page
A:
Q: and placements for a wide range of
A: Given, Ad-Board, Inc. handles radio and television promotional jobs and placements for a wide range…

Equations and Inequations
Equations and inequalities describe the relationship between two mathematical expressions.
Linear Functions
A linear function can just be a constant, or it can be the constant multiplied with the variable like x or y. If the variables are of the form, x2, x1/2 or y2 it is not linear. The exponent over the variables should always be 1.

Step by step
Solved in 2 steps with 2 images


- Sulaiman is planning to take his car for regular service. The work required in servicing is divided into several activities and represented in the below table along with the time taken for each task: ACTIVITY TASK Activitysymbol iMMEDIATEPREDECESSORS Duration (min) Open the petrol tank cap A - 2 Add petrol (Paid service) B A 14 Close the petrol tank cap C B 10 Open bonnet, check and add engineoil (Paid service) D - 19 Check radiator coolant, Checkbattery, Close bonnet E D 12 Clean the wind shield, Check airpressure in tires F - 12 Prepare bill G B,E 11 Collect payment H G 15 Draw the network diagram and find the earliest start and latest finish time of all the activities. Also determine thetotal project time for which Sulaiman will stay at the service station and list out the critical activities.Anela is a computer scientist who is formulating a large and complicated program for a type of data processing. She has three ways of storing and retrieving data: cloud storage, disk, or hard drive. As an experiment, she sets up her program in three different ways: one using cloud storage, one using disks, and the other using a hard drive. Then she makes four test runs of this type of data processing on each program. The time required to execute each program is shown in the following table (in minutes). Use a 0.01 level of significance to test the hypothesis that the mean processing time is the same for each method. Hard Drive Cloud Disks 8.4 6.8 7.2 9.3 9.6 6.8 8.1 7.0 9.6 8.3 7.9 8.6 (ii) Find the sample test statistic. (Round your F Ratio to two decimal places. Round all other answers to four decimal places.) (vi) In the case of one-way ANOVA, make a summary table. (Round your answers to three decimal places.)Anela is a computer scientist who is formulating a large and complicated program for a type of data processing. She has three ways of storing and retrieving data: cloud storage, disk, or hard drive. As an experiment, she sets up her program in three different ways: one using cloud storage, one using disks, and the other using a hard drive. Then she makes four test runs of this type of data processing on each program. The time required to execute each program is shown in the following table (in minutes). Use a 0.01 level of significance to test the hypothesis that the mean processing time is the same for each method. Hard Drive Cloud Disks 8.8 7.5 7.1 8.8 9.2 6.6 8.0 7.2 10.2 7.6 7.9 8.0 (i) Give the value of the level of significance. (ii) Find the sample test statistic. (Round your F Ratio to two decimal places. Round all other answers to four decimal places.) (vi) In the case of one-way ANOVA, make a summary table. (Round your answers to three decimal places.)…
- LL Pea stores clothes at five different locations. Severaltimes a day it sends an “order picker” out to each locationto pick up orders. Then the order picker must return to thepackaging area. Describe a TSP that could be used tominimize the time needed to pick up orders and return tothe packaging area.Anela is a computer scientist who is formulating a large and complicated program for a type of data processing. Anela has three ways of storing and retrieving data: cloud storage, disk, or hard drive. As an experiment, Anela sets up her program in three different ways: one using cloud storage, one using disks, and the other using a hard drive. Then Anela makes four test runs of this type of data processing on each program. The time required to execute each program is shown in the following table (in minutes). Use a 0.01 level of significance to test the hypothesis that the mean processing time is the same for each method. Hard Drive Cloud Disks 8.7 7.2 7.0 9.3 9.1 6.4 7.9 7.5 9.8 8.0 7.7 8.2Which of the following is the largest number of jobs that could theoretically be within the software industry at present, based on the information available? A) 1,4 million B) 2,4 million C) 4 million D) 8 million E) 10 million Transcribed Image Text:Preparing for Automation The possibility of having robots or mechanical assistants completing our laborious, dangerous, or repetitive day-to-day tasks has long been a dream of humanity. Now, as Robotic Process Automation (RPA) becomes commonplace, this dream or concern, depending on viewpoint - is getting closer. RPA, far from the walking, talking android commonly found in science fiction series, can be thought of as a programmable piece of software which, through using a series of rules, will complete repetitive tasks with a lower error rate and less interruption than a human completing the same tasks. The aim of RPA, beyond improving efficiency, is to free up humans from the monotony of roles like data entry, stock management and…
- Which of the following is the largest number of jobs that could theoretically be within the software industry at present, based on the information available? A) 1,4 million B) 2,4 million C) 4 million D) 8 million E) 10 millionIf there is no seasonal effect on human births, one would expect equal numbers of children to be born in each season (winter, spring, summer, and fall). A student takes a census of her statistics class and finds that of the 120 students in the class, 26 were born in winter, 37 in spring, 31 in summer, and 26 in fall. She wonders if the excess in the spring is an indication that births are not uniform throughout the year. Complete parts a) through c) below. A. What is the expected number of births in each season if there is no "seasonal effect" on births? B. Compute the chi squared-statistic. C. How many degrees of freedom does the chi squared-statistic have?A psychologist claims that the number of repeat offenders will tend to change if first time offenders complete a particular rehabilitation course. You randomly select 20 prisons and record the number of repeat offenders during a two year period. Then, after first time offenders complete the course, you record the number of repeat offenders at each prison for another two year period. The results are shown in the following table. Prison 1 2 3 4 5 6 7 8 9 10 11 12 13 14 15 16 17 18 19 20Before 21 34 9 45 30 54 37 36 33 40 11 25 13 8 14 21 18 33 40 10After 19 22 16 31 30 30 22 18 17 21 19 25 13 14 23 21 12 32 25 10Conduct a sign test at 0.05 significance level. Test if the number of offenders before rehabilitation is significantly different to the number of repeat offenders
- Town Date time Temp. max Temp. min temp Feels like max Feels like min Feels like dew London 2022-07-07 23.3 16.7 19.5 23.3 16.7 19.5 11.5 London 2022-07-08 26.9 15 21.2 26.7 15 21.2 12.4 London 2022-07-09 25 15.9 20.6 25 15.9 20.6 11.4 London 2022-07-10 26.6 14.7 20.8 26.6 14.7 20.8 12.3 London 2022-07-11 29 16.4 22.8 28.2 16.4 22.7 12.5 London 2022-07-12 30.1 18.4 23.9 28.6 18.4 23.6 12.2 London 2022-07-13 26.5 17.3 20.9 26.5 17.3 20.9 14.3 London 2022-07-14 23.5 12 17.7 23.5 12 17.7 7.4 London 2022-07-15 24.6 13.4 18.4 24.6 13.4 18.4 8.8 London 2022-07-16 30 13.6 21.7 29.4 13.6 21.5 11.7 London 2022-07-17 25.9 13.7 19.5 25.9 13.7 19.5 9.4 From the data/table above Calculate and discuss** the followings. Please provide the steps for the calculation…Town Date time Temp. max Temp. min temp Feels like max Feels like min Feels like dew London 2022-07-07 23.3 16.7 19.5 23.3 16.7 19.5 11.5 London 2022-07-08 26.9 15 21.2 26.7 15 21.2 12.4 London 2022-07-09 25 15.9 20.6 25 15.9 20.6 11.4 London 2022-07-10 26.6 14.7 20.8 26.6 14.7 20.8 12.3 London 2022-07-11 29 16.4 22.8 28.2 16.4 22.7 12.5 London 2022-07-12 30.1 18.4 23.9 28.6 18.4 23.6 12.2 London 2022-07-13 26.5 17.3 20.9 26.5 17.3 20.9 14.3 London 2022-07-14 23.5 12 17.7 23.5 12 17.7 7.4 London 2022-07-15 24.6 13.4 18.4 24.6 13.4 18.4 8.8 London 2022-07-16 30 13.6 21.7 29.4 13.6 21.5 11.7 London 2022-07-17 25.9 13.7 19.5 25.9 13.7 19.5 9.4 For the data above , use the linear forecasting model which is y = mx + c to calculate and discuss…Town Date time Temp. max Temp. min temp Feels like max Feels like min Feels like dew London 2022-07-07 23.3 16.7 19.5 23.3 16.7 19.5 11.5 London 2022-07-08 26.9 15 21.2 26.7 15 21.2 12.4 London 2022-07-09 25 15.9 20.6 25 15.9 20.6 11.4 London 2022-07-10 26.6 14.7 20.8 26.6 14.7 20.8 12.3 London 2022-07-11 29 16.4 22.8 28.2 16.4 22.7 12.5 London 2022-07-12 30.1 18.4 23.9 28.6 18.4 23.6 12.2 London 2022-07-13 26.5 17.3 20.9 26.5 17.3 20.9 14.3 London 2022-07-14 23.5 12 17.7 23.5 12 17.7 7.4 London 2022-07-15 24.6 13.4 18.4 24.6 13.4 18.4 8.8 London 2022-07-16 30 13.6 21.7 29.4 13.6 21.5 11.7 London 2022-07-17 25.9 13.7 19.5 25.9 13.7 19.5 9.4 From the data/table above Calculate and discuss** the followings. Please provide the steps for the calculation…
