following graph shows the market demand and supply curves for camisoles that are sold in a perfectly competitive market. Use the graph input tool to help you answer the following questions. You will not be graded on an changes you make to this graph, Note: Once you enter a value in a white field, the graph and any corresponding amounts in each grey fleld will change accordingly. Graph Input Tool Quantity Addng Marginal Utility (Dollars per čamisole) Marginal Cost (Dollars per camisole) 9. Demand QUANTITY (Carnisoles per day) If the economy produces and sells five camisoles (represented by the green line on the graph), the marginal utility (MU) of the last camisole bought is camisole sold is MC of the last camisole sold, so the market is , and the marginal cost (MC) of the last This means that the MU of the last camisole bought is the PRICE (Dolars per camisole)
following graph shows the market demand and supply curves for camisoles that are sold in a perfectly competitive market. Use the graph input tool to help you answer the following questions. You will not be graded on an changes you make to this graph, Note: Once you enter a value in a white field, the graph and any corresponding amounts in each grey fleld will change accordingly. Graph Input Tool Quantity Addng Marginal Utility (Dollars per čamisole) Marginal Cost (Dollars per camisole) 9. Demand QUANTITY (Carnisoles per day) If the economy produces and sells five camisoles (represented by the green line on the graph), the marginal utility (MU) of the last camisole bought is camisole sold is MC of the last camisole sold, so the market is , and the marginal cost (MC) of the last This means that the MU of the last camisole bought is the PRICE (Dolars per camisole)

Principles of Economics 2e
2nd Edition
ISBN:9781947172364
Author:Steven A. Greenlaw; David Shapiro
Publisher:Steven A. Greenlaw; David Shapiro
Chapter8: Perfect Competition
Section: Chapter Questions
Problem 1SCQ: Firms ill a perfectly competitive market are said to be price takers that is, once the market...

Related questions
Question
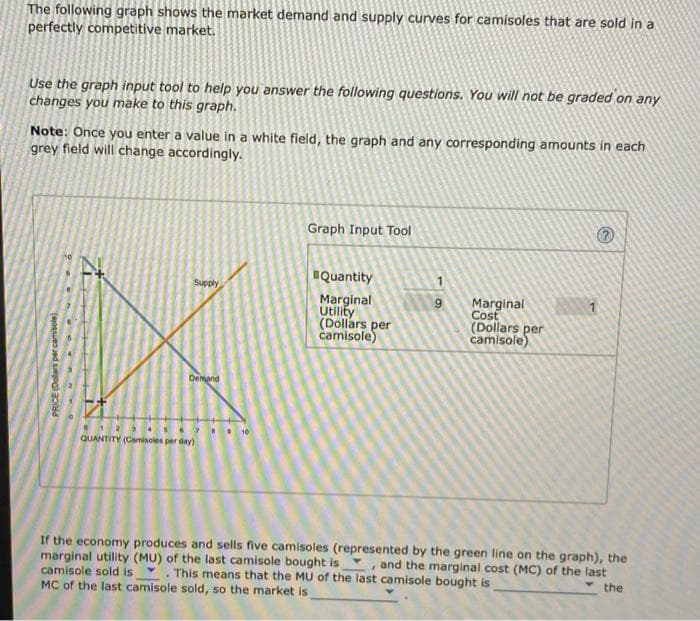
Transcribed Image Text:The following graph shows the market demand and supply curves for camisoles that are sold in a
perfectly competitive market.
Use the graph input tool to help you answer the following questions. You will not be graded on any
changes you make to this graph.
Note: Once you enter a value in a white field, the graph and any corresponding amounts in each
grey field will change accordingly.
Graph Input Tool
BQuantity
1
Supply
Marginal
Utility
(Dollars per
čamisole)
Marginal
Cost
6.
1
(Dollars per
camisole)
Demand
QUANTITY (Camisoles per day)
If the economy produces and sells five camisoles (represented by the green line on the graph), the
marginal utility (MU) of the last camisole bought isY, and the marginal cost (MC) of the last
camisole sold is
MC of the last camisole sold, so the market is
This means that the MU of the last camisole bought is
the
PRICE (Dolars per camisole)
Expert Solution
This question has been solved!
Explore an expertly crafted, step-by-step solution for a thorough understanding of key concepts.

This is a popular solution!

Trending now
This is a popular solution!

Step by step
Solved in 3 steps with 1 images

Knowledge Booster


Learn more about
Need a deep-dive on the concept behind this application? Look no further. Learn more about this topic, economics and related others by exploring similar questions and additional content below.Recommended textbooks for you
Principles of Economics 2e
Economics
ISBN:
9781947172364
Author:
Steven A. Greenlaw; David Shapiro
Publisher:
OpenStax
Principles of Economics 2e
Economics
ISBN:
9781947172364
Author:
Steven A. Greenlaw; David Shapiro
Publisher:
OpenStax