The blue curve on the fallowing graph represerts the demand curve facing a firm that can set its own prices. Use the graph input tool to help you answer the following questions. You will not be graded an any changes you make to this graph. Note: Once you enter a value in a white field, the graph and any corresponding amounts in each grey field will change accordingly. Graph Input Tool Market for Goods 250 guantity Bemanded 225 25 200 (Linita) 175 Demand Price 125.00 (Dolars per unit) 150 125 75 Demand 25 •s 10 15 20 s 0 35 0 45 s0 QUANTITY (Unt) On the graph input toal, change the number found in the Quantity Demanded feid to determine the prices that correspond to the production of 0, 10, 20, 25, 30, 40, and 50 units of output Calcuiate the total revenue for each of these praduction leveis. Then, on the fallowing graph, use the green paints (triangie symbal) to plet the resuts. 2017 Total Rrverue 2504 2101 PrECE (Dolan per unit)
The blue curve on the fallowing graph represerts the demand curve facing a firm that can set its own prices. Use the graph input tool to help you answer the following questions. You will not be graded an any changes you make to this graph. Note: Once you enter a value in a white field, the graph and any corresponding amounts in each grey field will change accordingly. Graph Input Tool Market for Goods 250 guantity Bemanded 225 25 200 (Linita) 175 Demand Price 125.00 (Dolars per unit) 150 125 75 Demand 25 •s 10 15 20 s 0 35 0 45 s0 QUANTITY (Unt) On the graph input toal, change the number found in the Quantity Demanded feid to determine the prices that correspond to the production of 0, 10, 20, 25, 30, 40, and 50 units of output Calcuiate the total revenue for each of these praduction leveis. Then, on the fallowing graph, use the green paints (triangie symbal) to plet the resuts. 2017 Total Rrverue 2504 2101 PrECE (Dolan per unit)

Microeconomics: Private and Public Choice (MindTap Course List)
16th Edition
ISBN:9781305506893
Author:James D. Gwartney, Richard L. Stroup, Russell S. Sobel, David A. Macpherson
Publisher:James D. Gwartney, Richard L. Stroup, Russell S. Sobel, David A. Macpherson
Chapter9: Price Takers And The Competitive Process
Section: Chapter Questions
Problem 11CQ

Related questions
Question
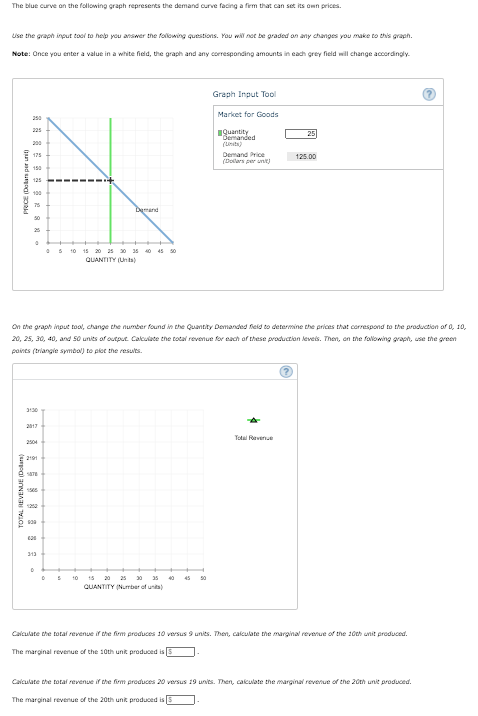
Transcribed Image Text:The blue curve on the fallowing graph represents the demand curve facing a firm that can set its own prices.
Use the graph input tool to help you answer the following questions. You will not be graded on any changes you make to this graph.
Note: Once you enter a value in a white field, the graph and any corresponding amounts in each grey field will change accordingly.
Graph Input Tool
Market for Goods
250
225
1guantity
25
"Demanded
(inita)
200
Demand Price
(Dolars per unitJ
175
125.00
E 150
125
100
75
Damand
50
10
15 20 25 30 35 40 45 s0
QUANTITY (Unta)
On the graph input tool, change the number found in the Quantity Demanded feld to determine the prices that correspond to the production of D, 10,
20, 25, 30, 40, and S0 units of output Calculate the total revenue for each of these production leveis. Then, on the fallowing graph, use the green
paints (triangie symbol) to plot the resuts.
3130
2017
Total Revenue
2504
2191
SATE
313
15 20 25 30 35
QUANTITY (Nurber of unita)
10
40
45
50
Calculate the total revenue if the firm produces 10 versus 9 units. Then, calculate the marginal revenue of the 20th unit produced.
The marginal revenue of the 10th unit produced is 5
Calculate the total revenue if the firm produces 20 versus 19 units. Then, calculate the marginal revenue of the 20th unit produced.
The marginal revenue of the 20th unit produced is 5
PRRCE (Dolars per unit)
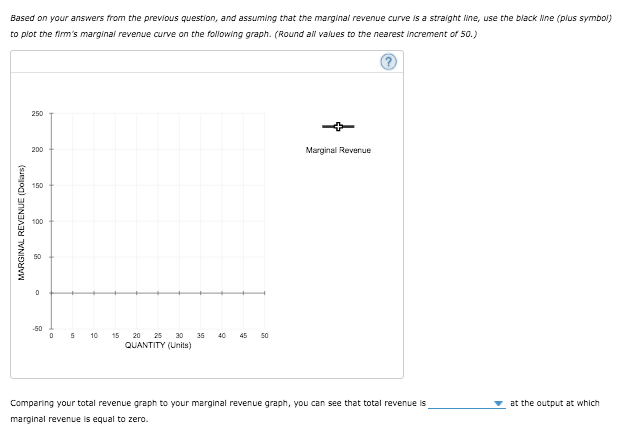
Transcribed Image Text:Based on your answers from the previous question, and assuming that the marginal revenue curve is a straight ine, use the black Nne (plus symbol)
to plot the firm's marginal revenue curve on the following graph. (Round all values to the nearest Increment of 50.)
250
200
Marginal Revenue
150
100
50
-50
10
15
20 25 30
35
40
45
50
QUANTITY (Units)
Comparing your total revenue graph to your marginal revenue graph, you can see that total revenue is
at the output at which
marginal revenue is equal to zero.
MARGINAL REVENUE (Dolars)
Expert Solution
This question has been solved!
Explore an expertly crafted, step-by-step solution for a thorough understanding of key concepts.

This is a popular solution!

Trending now
This is a popular solution!

Step by step
Solved in 3 steps with 2 images

Knowledge Booster


Learn more about
Need a deep-dive on the concept behind this application? Look no further. Learn more about this topic, economics and related others by exploring similar questions and additional content below.Recommended textbooks for you
Microeconomics: Private and Public Choice (MindTa…
Economics
ISBN:
9781305506893
Author:
James D. Gwartney, Richard L. Stroup, Russell S. Sobel, David A. Macpherson
Publisher:
Cengage Learning

Economics: Private and Public Choice (MindTap Cou…
Economics
ISBN:
9781305506725
Author:
James D. Gwartney, Richard L. Stroup, Russell S. Sobel, David A. Macpherson
Publisher:
Cengage Learning

Exploring Economics
Economics
ISBN:
9781544336329
Author:
Robert L. Sexton
Publisher:
SAGE Publications, Inc
Microeconomics: Private and Public Choice (MindTa…
Economics
ISBN:
9781305506893
Author:
James D. Gwartney, Richard L. Stroup, Russell S. Sobel, David A. Macpherson
Publisher:
Cengage Learning
Economics: Private and Public Choice (MindTap Cou…
Economics
ISBN:
9781305506725
Author:
James D. Gwartney, Richard L. Stroup, Russell S. Sobel, David A. Macpherson
Publisher:
Cengage Learning
Exploring Economics
Economics
ISBN:
9781544336329
Author:
Robert L. Sexton
Publisher:
SAGE Publications, Inc


