Food Output (units per year) Multiple Choice KLM Clothing Output (units per year) Figure 1.7 Refer to Figure 1.7. The cost of producing at point D rather than point J is OM units of clothing. OA units of food. G KM units of clothing. O AC units of food.
Food Output (units per year) Multiple Choice KLM Clothing Output (units per year) Figure 1.7 Refer to Figure 1.7. The cost of producing at point D rather than point J is OM units of clothing. OA units of food. G KM units of clothing. O AC units of food.

ChapterA: Working With Diagrams
Section: Chapter Questions
Problem 1QP

Related questions
Question
Transcribed Image Text:Food Output
(units per year)
B
n
T
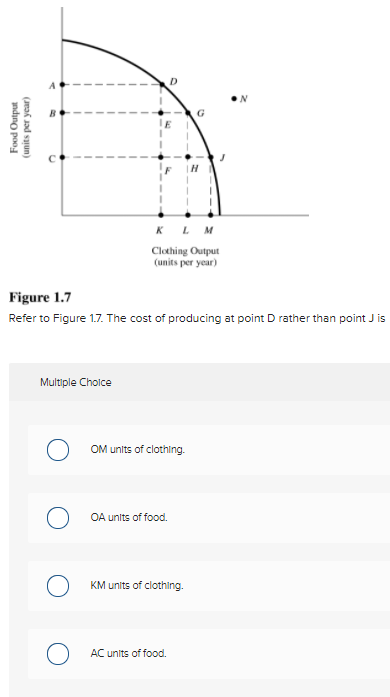
Figure 1.7
Refer to Figure 1.7. The cost of producing at point D rather than point J is
Multiple Choice
KLM
Clothing Output
(units per year)
O
O OM units of clothing.
OA units of food.
KM units of clothing.
AC units of food.
Expert Solution
This question has been solved!
Explore an expertly crafted, step-by-step solution for a thorough understanding of key concepts.

Step by step
Solved in 3 steps

Knowledge Booster


Learn more about
Need a deep-dive on the concept behind this application? Look no further. Learn more about this topic, economics and related others by exploring similar questions and additional content below.Recommended textbooks for you


Economics (MindTap Course List)
Economics
ISBN:
9781337617383
Author:
Roger A. Arnold
Publisher:
Cengage Learning
Economics (MindTap Course List)
Economics
ISBN:
9781337617383
Author:
Roger A. Arnold
Publisher:
Cengage Learning

Exploring Economics
Economics
ISBN:
9781544336329
Author:
Robert L. Sexton
Publisher:
SAGE Publications, Inc

Principles of Economics 2e
Economics
ISBN:
9781947172364
Author:
Steven A. Greenlaw; David Shapiro
Publisher:
OpenStax

Microeconomics: Principles & Policy
Economics
ISBN:
9781337794992
Author:
William J. Baumol, Alan S. Blinder, John L. Solow
Publisher:
Cengage Learning