Price (Dollars per gallon of orange juice) 2 a 4 6 8 10 9 (aoni abue Quantity Demanded (Gallons of orange juice) 500 400 300 200 100 On the following graph, plot the demand for orange juice using the blue point (circle symbol). Next, plot the supply point (square symbol). Finally, use the black point (plus symbol) to indicate the equilibrium price and quantity in tr Note: Plot your points in the order in which you would like them connected. Line segments will connect the points Quantity Supplied (Gallons of orange juice) 50 150 200 300 450 Demand -9
Price (Dollars per gallon of orange juice) 2 a 4 6 8 10 9 (aoni abue Quantity Demanded (Gallons of orange juice) 500 400 300 200 100 On the following graph, plot the demand for orange juice using the blue point (circle symbol). Next, plot the supply point (square symbol). Finally, use the black point (plus symbol) to indicate the equilibrium price and quantity in tr Note: Plot your points in the order in which you would like them connected. Line segments will connect the points Quantity Supplied (Gallons of orange juice) 50 150 200 300 450 Demand -9

Chapter4: Supply And Demand: An Initial Look
Section: Chapter Questions
Problem 2TY

Related questions
Question
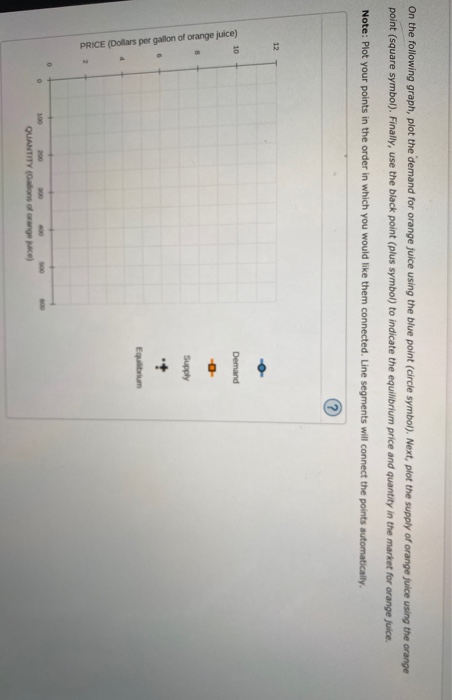
Transcribed Image Text:On the following graph, plot the demand for orange juice using the blue point (circle symbol). Next, plot the supply of orange juice using the orange
point (square symbol). Finally, use the black point (plus symbol) to indicate the equilibrium price and quantity in the market for orange juice.
Note: Plot your points in the order in which you would like them connected. Line segments will connect the points automatically.
?
12
10
PRICE (Dollars per gallon of orange juice)
0
100
200
300
400
QUANTITY (Gallons of orange juice)
500
Demand
-0
Supply
Equilibrium
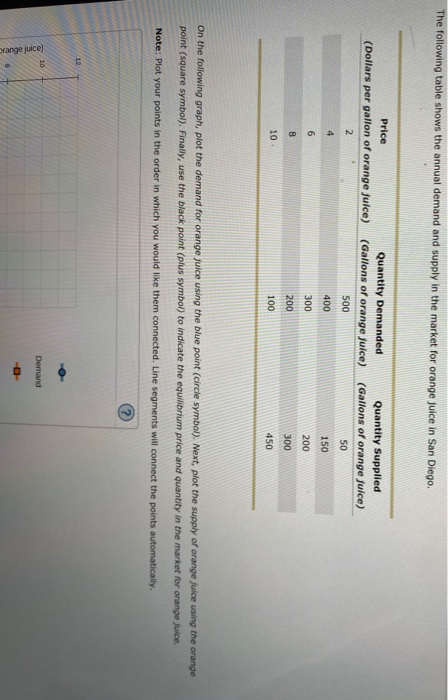
Transcribed Image Text:The following table shows the annual demand and supply in the market for orange juice in San Diego.
Price
(Dollars per gallon of orange juice)
2
12
4
6
8
10
9
(axınl abuex
Quantity Demanded
(Gallons of orange juice)
500
400
300
200
100
On the following graph, plot the demand for orange juice using the blue point (circle symbol). Next, plot the supply of orange juice using the orange
point (square symbol). Finally, use the black point (plus symbol) to indicate the equilibrium price and quantity in the market for orange juice.
Note: Plot your points in the order in which you would like them connected. Line segments will connect the points automatically.
Quantity Supplied
(Gallons of orange juice)
50
150
200
300
450
Demand
--
Expert Solution
This question has been solved!
Explore an expertly crafted, step-by-step solution for a thorough understanding of key concepts.

This is a popular solution!

Trending now
This is a popular solution!

Step by step
Solved in 3 steps with 2 images

Knowledge Booster


Learn more about
Need a deep-dive on the concept behind this application? Look no further. Learn more about this topic, economics and related others by exploring similar questions and additional content below.Recommended textbooks for you

Exploring Economics
Economics
ISBN:
9781544336329
Author:
Robert L. Sexton
Publisher:
SAGE Publications, Inc

Managerial Economics: A Problem Solving Approach
Economics
ISBN:
9781337106665
Author:
Luke M. Froeb, Brian T. McCann, Michael R. Ward, Mike Shor
Publisher:
Cengage Learning
Exploring Economics
Economics
ISBN:
9781544336329
Author:
Robert L. Sexton
Publisher:
SAGE Publications, Inc
Managerial Economics: A Problem Solving Approach
Economics
ISBN:
9781337106665
Author:
Luke M. Froeb, Brian T. McCann, Michael R. Ward, Mike Shor
Publisher:
Cengage Learning

Brief Principles of Macroeconomics (MindTap Cours…
Economics
ISBN:
9781337091985
Author:
N. Gregory Mankiw
Publisher:
Cengage Learning


Economics (MindTap Course List)
Economics
ISBN:
9781337617383
Author:
Roger A. Arnold
Publisher:
Cengage Learning