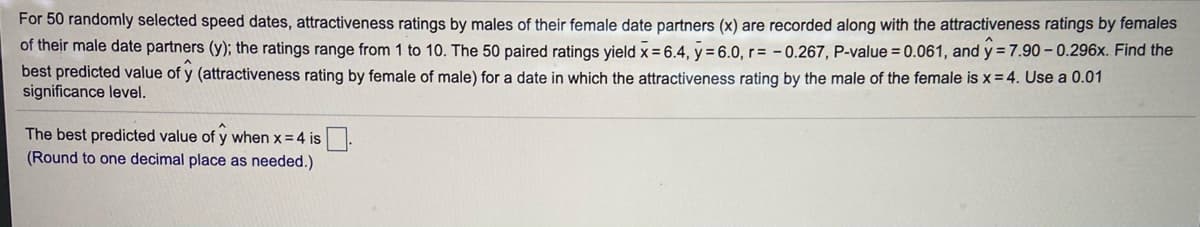
For 50 randomly selected speed dates, attractiveness ratings by males of their female date partners (x) are recorded along with the attractiveness ratings by females of their male date partners (y); the ratings range from 1 to 10. The 50 paired ratings yield x= 6.4, y = 6.0, r= - 0.267, P-value = 0.061, and y= 7.90- 0.296x. Find the best predicted value of y (attractiveness rating by female of male) for a date in which the attractiveness rating by the male of the female is x= 4. Use a 0.01 significance level. The best predicted value of y when x = 4 is. (Round to one decimal place as needed.)


Correlation
Correlation defines a relationship between two independent variables. It tells the degree to which variables move in relation to each other. When two sets of data are related to each other, there is a correlation between them.
Linear Correlation
A correlation is used to determine the relationships between numerical and categorical variables. In other words, it is an indicator of how things are connected to one another. The correlation analysis is the study of how variables are related.
Regression Analysis
Regression analysis is a statistical method in which it estimates the relationship between a dependent variable and one or more independent variable. In simple terms dependent variable is called as outcome variable and independent variable is called as predictors. Regression analysis is one of the methods to find the trends in data. The independent variable used in Regression analysis is named Predictor variable. It offers data of an associated dependent variable regarding a particular outcome.


Trending now
This is a popular solution!

Step by step
Solved in 2 steps


