For a sample of 48 monthly observations the regression of the percentage return on an investment (y) against the percentage change in the consumer price index (x) was estimated. The sample regression line, obtained through least squares, is shown below The estimated standard deviation of the slope of the population regression line was 1.8. Test the null hypothesis that the slope of the population regression line is 0 against the alternative that the slope is positive. Use a = 0.01. y = -0.003 + 8.2x Find the t-statistic. %3D (Round to two decimal places as needed.) Find the exact p-value, using Excel. The p-value is (Round to two decimal places as needed.) (1) Họ. There is (2) evidence that the slope coefficient is greater than zero. (1) O Do not reject O Reject (2) O sufficient O insufficient
For a sample of 48 monthly observations the regression of the percentage return on an investment (y) against the percentage change in the consumer price index (x) was estimated. The sample regression line, obtained through least squares, is shown below The estimated standard deviation of the slope of the population regression line was 1.8. Test the null hypothesis that the slope of the population regression line is 0 against the alternative that the slope is positive. Use a = 0.01. y = -0.003 + 8.2x Find the t-statistic. %3D (Round to two decimal places as needed.) Find the exact p-value, using Excel. The p-value is (Round to two decimal places as needed.) (1) Họ. There is (2) evidence that the slope coefficient is greater than zero. (1) O Do not reject O Reject (2) O sufficient O insufficient

Chapter4: Linear Functions
Section: Chapter Questions
Problem 30PT: For the following exercises, use Table 4 which shows the percent of unemployed persons 25 years or...

Related questions
Question
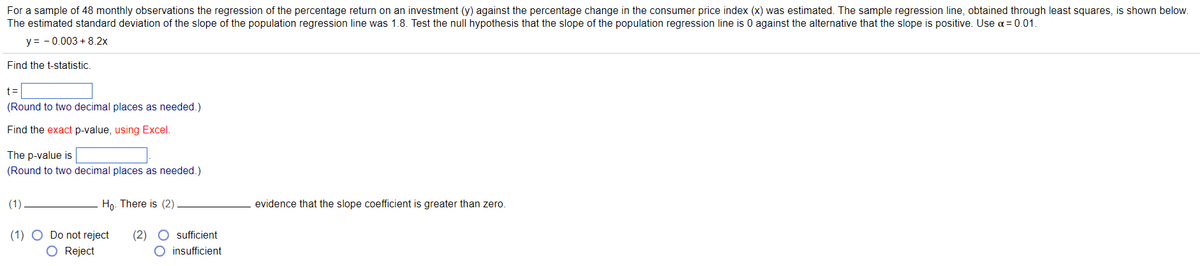
Transcribed Image Text:For a sample of 48 monthly observations the regression of the percentage return on an investment (y) against the percentage change in the consumer price index (x) was estimated. The sample regression line, obtained through least squares, is shown below.
The estimated standard deviation of the slope of the population regression line was 1.8. Test the null hypothesis that the slope of the population regression line is 0 against the alternative that the slope is positive. Use a = 0.01.
y = - 0.003 + 8.2x
Find the t-statistic.
%3D
(Round to two decimal places as needed.)
Find the exact p-value, using Excel.
The p-value is
(Round to two decimal places as needed.)
(1)
Hp. There is (2)
evidence that the slope coefficient is greater than zero.
(1) O Do not reject
O Reject
(2)
sufficient
O insufficient
Expert Solution
This question has been solved!
Explore an expertly crafted, step-by-step solution for a thorough understanding of key concepts.

This is a popular solution!

Trending now
This is a popular solution!

Step by step
Solved in 2 steps

Recommended textbooks for you

Linear Algebra: A Modern Introduction
Algebra
ISBN:
9781285463247
Author:
David Poole
Publisher:
Cengage Learning

College Algebra
Algebra
ISBN:
9781305115545
Author:
James Stewart, Lothar Redlin, Saleem Watson
Publisher:
Cengage Learning
Linear Algebra: A Modern Introduction
Algebra
ISBN:
9781285463247
Author:
David Poole
Publisher:
Cengage Learning
College Algebra
Algebra
ISBN:
9781305115545
Author:
James Stewart, Lothar Redlin, Saleem Watson
Publisher:
Cengage Learning

Glencoe Algebra 1, Student Edition, 9780079039897…
Algebra
ISBN:
9780079039897
Author:
Carter
Publisher:
McGraw Hill

Functions and Change: A Modeling Approach to Coll…
Algebra
ISBN:
9781337111348
Author:
Bruce Crauder, Benny Evans, Alan Noell
Publisher:
Cengage Learning