For an individual with a trust in government score of 3, what would their predicted Y be? (Do not round your result.) Enter only the answer.
For an individual with a trust in government score of 3, what would their predicted Y be? (Do not round your result.) Enter only the answer.

MATLAB: An Introduction with Applications
6th Edition
ISBN:9781119256830
Author:Amos Gilat
Publisher:Amos Gilat
Chapter1: Starting With Matlab
Section: Chapter Questions
Problem 1P

Related questions
Question
Need help
Transcribed Image Text:For an individual with a trust in government score of 3, what would their predicted Y be? (Do not round your result.)
Enter only the answer.
Transcribed Image Text:Model
1
Model
1
R
103ª
Model
1
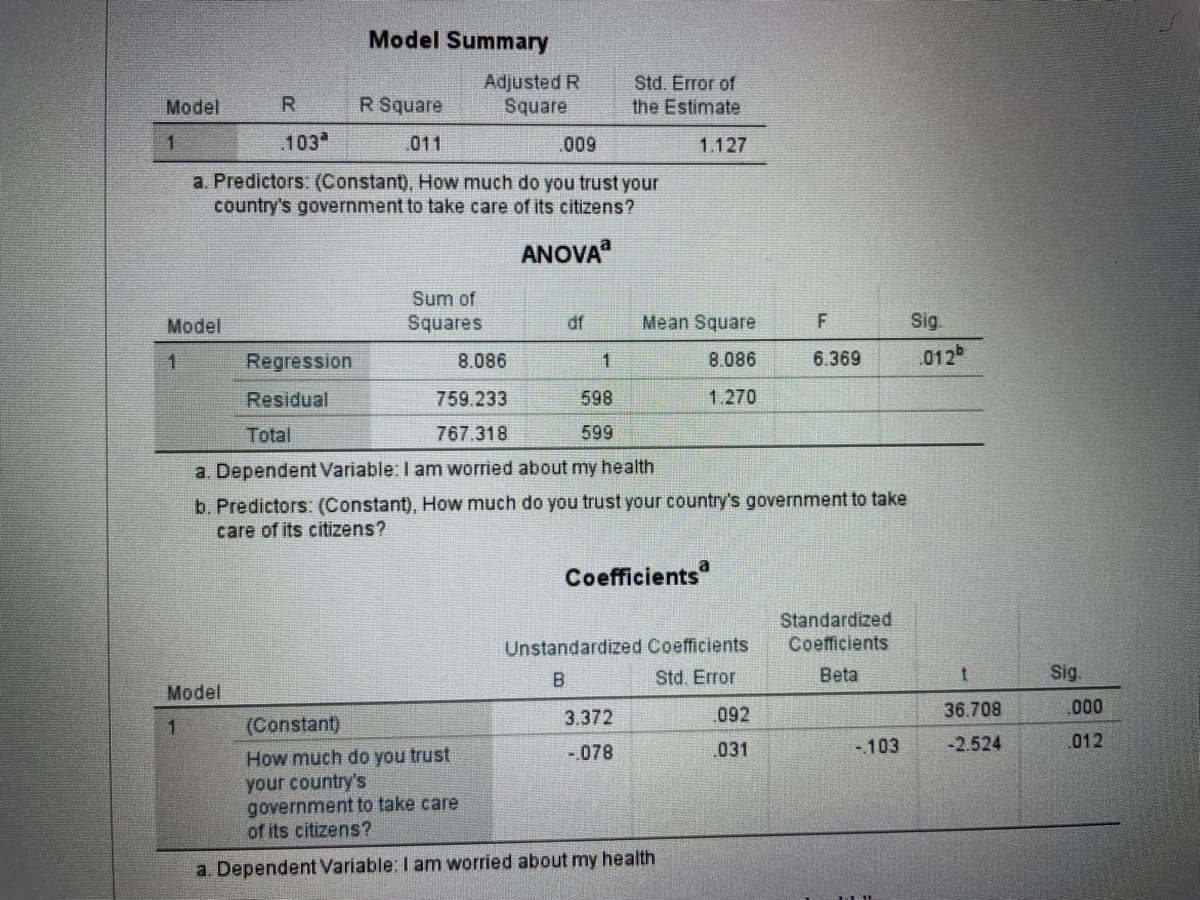
Model Summary
Regression
Residual
R Square
011
.009
a. Predictors: (Constant), How much do you trust your
country's government to take care of its citizens?
ANOVA
Adjusted R
Square
Sum of
Squares
(Constant)
How much do you trust
your country's
df
Std. Error of
the Estimate
1.127
8.086
1
759.233
598
Total
767.318
599
a. Dependent Variable: I am worried about my health
b. Predictors: (Constant), How much do you trust your country's government to take
care of its citizens?
Mean Square
8.086
1.270
Coefficients
3.372
-078
Unstandardized Coefficients
B
Std. Error
government to take care
of its citizens?
a. Dependent Variable: I am worried about my health
F
6.369
.092
031
Standardized
Coefficients
Beta
-.103
Sig.
012
t
36.708
-2.524
Sig.
.000
012
Expert Solution
This question has been solved!
Explore an expertly crafted, step-by-step solution for a thorough understanding of key concepts.

Step by step
Solved in 2 steps with 2 images

Recommended textbooks for you
MATLAB: An Introduction with Applications
Statistics
ISBN:
9781119256830
Author:
Amos Gilat
Publisher:
John Wiley & Sons Inc

Probability and Statistics for Engineering and th…
Statistics
ISBN:
9781305251809
Author:
Jay L. Devore
Publisher:
Cengage Learning

Statistics for The Behavioral Sciences (MindTap C…
Statistics
ISBN:
9781305504912
Author:
Frederick J Gravetter, Larry B. Wallnau
Publisher:
Cengage Learning
MATLAB: An Introduction with Applications
Statistics
ISBN:
9781119256830
Author:
Amos Gilat
Publisher:
John Wiley & Sons Inc
Probability and Statistics for Engineering and th…
Statistics
ISBN:
9781305251809
Author:
Jay L. Devore
Publisher:
Cengage Learning
Statistics for The Behavioral Sciences (MindTap C…
Statistics
ISBN:
9781305504912
Author:
Frederick J Gravetter, Larry B. Wallnau
Publisher:
Cengage Learning

Elementary Statistics: Picturing the World (7th E…
Statistics
ISBN:
9780134683416
Author:
Ron Larson, Betsy Farber
Publisher:
PEARSON

The Basic Practice of Statistics
Statistics
ISBN:
9781319042578
Author:
David S. Moore, William I. Notz, Michael A. Fligner
Publisher:
W. H. Freeman

Introduction to the Practice of Statistics
Statistics
ISBN:
9781319013387
Author:
David S. Moore, George P. McCabe, Bruce A. Craig
Publisher:
W. H. Freeman