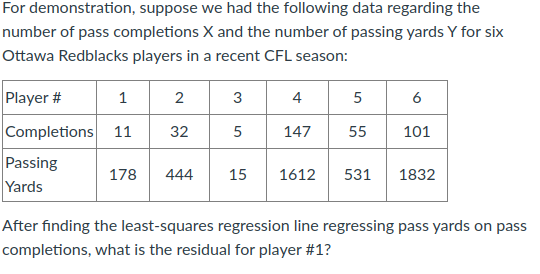
For demonstration, suppose we had the following data regarding the number of pass completions X and the number of passing yards Y for six Ottawa Redblacks players in a recent CFL season: Player # 1 3 4 5 6 Completions 11 32 5 147 55 101 Passing Yards 178 444 15 1612 531 1832 After finding the least-squares regression line regressing pass yards on pass completions, what is the residual for player #1? 2.


Q: The following data set, Practice Problem10.xls . gives the bone strengths of the dominant and the…
A: Given: dominant = 2.74 + 0.936×nondominant
Q: ieh of the following statements is true? a) About 95.3% of the variation in tread depth is explained…
A:
Q: blood pressure measurement consists of two numbers: the systolic pressure, which is the maximum…
A: Given Systolic Diastolic 130 76 116 70 133 91 112 75 134 87…
Q: birth weights (in pounds), x, and the lengths (in inches), y, for a set of newborn babies at a local…
A: NOTE:The data set is as follows; Birth Weight (in Pounds), x-12,10,88,11,11,33,55,44,77,66…
Q: The following information represents the income x (in $10,000) and happiness s T= 4.5 ỹ= 3.4 2 -…
A: Let y = a + bx be the regression line. Here a is the intercept and b is the slope. The formula…
Q: The following summary statistics resulted from a study of the relationship between the cost of a…
A: Solution: The following summary statistics resulted from a study of the relationship between the…
Q: 1. (20%) Use least-squares regression to fit the following data to 6. 2 4. 11 12 15 17 19 6 6 9 8 7…
A:
Q: In a controlled experiment, the height Y in feet of a tree and the amount of water x in ounces…
A: The variable y is height and the variable x is amount of water.
Q: ports analyst determines that the number of points scored in a basketball game is related to the…
A: Given Regression line is ŷ = 5.0 + 1.2x If x=50 y=?
Q: 13)The following table presents the average price in dollars for a dozen eggs and a gallon of milk…
A: a) In this case the variable “price of milk” (y) is the dependent variable and the “”price of egg”…
Q: The following data represents the rate of return of the stock exchange (x) and the rate of return of…
A: Using Excel > Data > Data analysis > Regression, we get following output table:
Q: 2. The following table shows the weights(?) to the nearest pound, heights(X) to the nearest inch,…
A: Given: z x y 94 57 8 71 59 10 53 49 6 67 62 11 55 51 8 58 50 7 77 55 10 57 48 9…
Q: A study was conducted to detemine whether a the final grade of a student in an introductory…
A:
Q: Compute the y-intercept bo of the least-square regression line. Round your answer to 3 decimal…
A: Regression: Regression is a technique that is used to determine relationship between two or more…
Q: An engineer wants to predict the value for y when x = 4.5, using the following data set. z = Iny х y…
A: A) Scatter plot of Y vs x
Q: 11.6 Use the output from Minitab for these data to answer the following questions. (Instead of using…
A: “Since you have posted a question with multiple sub-parts, we will solve first three subparts for…
Q: The following table lists the birth weights (in pounds), x, and the lengths (in inches), y, for a…
A: We have given that x and y data And we want to find Regression equation .
Q: Suppose Wesley is a marine biologist who is interested in the relationship between the age and the…
A: The regression equation is given as Ŷ = 8.2052 + 0.5693X.
Q: The following table gives retail values of a 2017 Corvette for various odometer readings. Odometer…
A: There are Odometer readings and Retail value given in the question and we have to find the answers.
Q: The table gives the readings from a laboratory experiment 3 6. 9. 17 49 71 161 A curve of the form…
A: Given the data of label experiment data t 2 3 5 6 9 y 7 17 49 71 161 We have to use method…
Q: study was conducted to detemine whether a the final grade of a student in an introductory psychology…
A:
Q: Compute the least-squares regression line for the given data set. 4 6. 7. 8.5 8.4 10 11.3 11.9 13.1…
A:
Q: In a controlled experiment, the height Y in feet of a tree and the amount of water x in ounces…
A: Solution-: For Regression line Y on X: Given: n=8,∑xi=192,∑yi=258,∑xi2=5280,∑xi*yi=6864 We want to…
Q: 4. Can the speed of a vehicle be predicted by the age of its driver? The speeds Y (in km/h) of a…
A: Since you have posted a question with multiple sub-parts, we will solve first three sub- parts for…
Q: For the following data, compute the least squares regression line for predicting gpagiven SAT. SAT:…
A: Regression: In order to obtain the least square regression line, first perform regression analysis…
Q: The following data represents the rate of return of the stock exchange (x) and the rate of return of…
A: Solution: As per the guidelines only first three sub parts should be answered. If the remaining…
Q: 30. The following data represents the number of days absent, x, and the final grade, y, for a sample…
A: Given : No. of absences x Final Grade y 0 89.2 1 86.4 2 83.5 3 81.1 4 78.2 5 73.9…
Q: The manager of a company is interested in studying the effect of price (X) on the sales (Y) of a new…
A:
Q: x y 10 8.04 8 6.95 13 7.58 9 8.81 11 8.33 14 9.96 6 7.23 4 4.26 12 10.84 5) The…
A: In this case x is the independent variable and y is the dependent variable.
Q: Given the least squares regression line ŷ = −2.88 + 1.77x, and a coefficient of determination of…
A: Given Coefficient of determination = 0.81 to find coefficient of correlation
Q: For the following data set: x 3.9 6.1 4.6 3.7 1.8 3.3 3.4 y 4.2 4.7 5.7 4.5 9.6 5.2 4.3 Part 1…
A: In order to obtain the regression line, first perform regression analysis on the data. The software…
Q: The following represents math and English SAT scores for 8 freshmen. English 440 435 380 610 375 490…
A: Given data: The math and English SAT scores for 8 freshmen as follows: English Math 435 340…
Q: The following scatterplot shows two variables along with a least-squares regression line. y 26- 24-…
A: Identify the correct option for the outlier that represented in the Scatterplot. The correct…
Q: Given are five observations for two variables, and . Xi 1 2 3 4 5 Yi 4 7 7 12 14 The…
A:
Q: Given n data pairs, (x₁, y₁),... (xn, Yn), the values of the two constants in the least squares…
A:
Q: For many people, the women's figure skating competition is the highlight of the Olympic Winter…
A: From the above data
Q: 3. Use least-squares regression to fit a straight line to the given data below: 11 12 15 17 19. O 2…
A: The formula for the least squares linear regression is y=mx+b. Here, m=n∑xy-∑x∑yn∑x2-∑x2 and…
Q: In a simple lineur regression problem, the least squares line is -2.73- 1.02, and the coefficient of…
A: As per our guidelines we are suppose to do only one questionGIvenleast squares line…
Q: For a sample of 8 employees, a personnel director has collected the following data on ownership of…
A: a) Excel Procedure: Enter X and Y in Excel>Data>Data Analysis> ‘Regression’>Select Y…
Q: Price of eggs and milk: The following table presents the average price in dollars for a dozen eggs…
A:
Q: A sports analyst determines that the number of points Scored in a basketball game is related to the…
A:
Q: In a controlled experiment, the height Y in feet of a tree and the amount of water x in ounces…
A: General form of least square line Y to x is as follows, y^ = b0 + b1x Where , b1 is slope of…
Q: The following table represents the average price (in dollars) for a dozen eggs and a gallon of milk…
A: The regression equation is given by y' = bx + a
Q: The following Minitab display gives information regarding the relationship between the body weight…
A: Let the independent variable X denote the metabolic rate of child Let the dependent variable Y…
Q: Is each of these True or False? (i) The least squares regression line is the line that minimizes…
A: Note: Hey there! Thank you for the question. As you have posted a question with more than 3…
Q: The following output from MINITAB presents the results from computing a least-squares regression…
A:
Q: A study was conducted to detemine whether a the final grade of a student in an introductory…
A: For the given data estimate x =100 y =?
Q: Consider the following data on the number of hours which 10 persons lied for a test and their scores…
A:
Q: The following table is an abbreviated life expectancy table for males. current age, x 0 20 40 60…
A: The life expectancy table is given as Current age(x)020406080life…
Q: Given the least squares regression line ˆy = 5.2 – 1.2x, and a coefficient of determination of…
A: The regression equation and coefficient of determination are given. From the given estimates, this…

Step by step
Solved in 3 steps with 4 images

- Suppose a doctor measures the height, x, and head circumference, y, of 11 children and obtains the data below. The correlation coefficient is 0.904 and the least squares regression line is y=0.208x+11.736. Complete parts (a) and (b) below.A scatterplot of student height, in inches, versus corresponding arm span length, in inches, is shown below. One of the points in the graph is labeled A. If the point labeled A is removed, which of the following statements would be true? The slope of the least squares regression line is unchanged and the correlation coefficient increases. The slope of the least squares regression line is unchanged and the correlation coefficient decreases. The slope of the least squares regression line increases and the correlation coefficient increases. The slope of the least squares regression line increases and the correlation coefficient decreases. The slope of the least squares regression line decreases and the correlation coefficient increases.Is a baseball players' slugging percentage correlated to their strikeout percentage? A random sample of n=6n=6professional baseball players gave the following data (Source: baseball-reference.com) Slugging 0.396 0.42 0.323 0.078 0.473 0.467 Strikeouts 27 14.3 30.8 47.1 17.8 36.7 Find the least squares line if we consider slugging percengtage as the explanatory variable and strikeout percentage as the response variable. (Round the y-intercept and slope to 2 decimal places.)y^ = For a unit increase in slugging percentage, how much of a decrease Correct in strikeout percentage is predicted? (Round your answer to 2 decimal places.) What percentage of the variation in strikeout percentage (yy) can be explained by slugging percentage (xx) and the least squares line? (Round to the nearest percent.) p-value (Round to four decimal places)
- The following table presents the percentage of students who tested proficient in reading and the percentage who tested proficient in math for each of the ten most populous states in the United States. State Percent Proficient in Reading Percent Proficient in Mathematics California 60 59 Texas 73 78 New York 75 70 Florida 66 68 Illinois 75 70 Pennsylvania 79 77 Ohio 79 76 Michigan 73 66 Georgia 67 64 North Carolina 71 73 Compute the least-squares regression line for predicting math proficiency from reading proficiency. Predict the math proficiency for another state with reading proficiency of 63 percent.An article included a summary of findings regarding the use of SAT I scores, SAT II scores, and high school grade point average (GPA) to predict first-year college GPA. The article states that "among these, SAT II scores are the best predictor, explaining 17 percent of the variance in first-year college grades. GPA was second at 15.2 percent, and SAT I was last at 13.1 percent." If the data from this study were used to fit a least squares line with y = first-year college GPA and x = high school GPA, what would the value of r2 have been? R2 ____________________%A regional distributor of NIKE shoes is in the process of analyzing the factors that influence thedemand for the NIKE brand. The distributor hired an economist to conduct a study on the demand for this product. The economist collected quarterly time series data from 1986Q1 to 1991Q4 on the following variables:SALES Sales of NIKE shoesRPDI Real personal disposal incomeCONF Consumer confidence indexD2 Dummy variable for quarter 2D3 Dummy variable for quarter 3D4 Dummy variable for quarter 4Ordinary Least Squares was applied using sales as the dependent variable and real personal disposal income, consumer confidence index, dummy variable for quarter 2, dummy variable for quarter 3, and dummy variable for quarter 4 as independent variables. The table below shows the OLS output.Model 1: OLS, using observations 1986:1-1991:4 (T = 24)Dependent variable: SALESCoefficient Std. Error t-ratio p-valueconst −139.452 61.8421 −2.255 0.0368 **RPDI 1.56286 0.438492 3.564 0.0022 ***CONF 0.256247…
- A regional distributor of NIKE shoes is in the process of analyzing the factors that influence thedemand for the NIKE brand. The distributor hired an economist to conduct a study on the demand for this product. The economist collected quarterly time series data from 1986Q1 to 1991Q4 on the following variables:SALES Sales of NIKE shoesRPDI Real personal disposal incomeCONF Consumer confidence indexD2 Dummy variable for quarter 2D3 Dummy variable for quarter 3D4 Dummy variable for quarter 4Ordinary Least Squares was applied using sales as the dependent variable and real personal disposal income, consumer confidence index, dummy variable for quarter 2, dummy variable for quarter 3, and dummy variable for quarter 4 as independent variables. The table below shows the OLS output.Model 1: OLS, using observations 1986:1-1991:4 (T = 24)Dependent variable: SALESCoefficient Std. Error t-ratio p-valueconst −139.452 61.8421 −2.255 0.0368 **RPDI 1.56286 0.438492 3.564 0.0022 ***CONF 0.256247…A suburban hotel derives its revenue from its hotel and restaurant operations. Theowners are interested in the relationship between the number of rooms occupied on anightly basis and the revenue per day in the restaurant. Below is a sample of 25 days(Monday through Thursday) from last year showing the restaurant income and numberof rooms occupied.Compute the least-squares regression line for the given data set.
- 1. An article included a summary of findings regarding the use of SAT I scores, SAT II scores, and high school grade point average (GPA) to predict first-year college GPA. The article states that "among these, SAT II scores are the best predictor, explaining 17 percent of the variance in first-year college grades. GPA was second at 15.3 percent, and SAT I was last at 13.6 percent." If the data from this study were used to fit a least squares line with y = first-year college GPA and x = high school GPA, what would the value of r2 have been? r2 =_______ 2. A study was carried out to investigate the relationship between the hardness of molded plastic (y, in Brinell units) and the amount of time elapsed since the plastic was molded (x, in hours). Summary quantities include n = 15, SSResid = 1,237.628, and SSTo = 24,619.737. Calculate and interpret the coefficient of determination. (Round the coefficient of determination to four decimal places when written as a decimal and 2 decimal…Consider a regression analysis with n = 47 and three potential independent variables. Suppose that one of the independent variables has a correlation of 0.95 with the dependent variable. Does this imply that this independent variable will have a very large Student’s t statistic in the regression analysis with all three predictor variables?Consider the fitted values from a simple linear regression model with intercept: yˆ = 7 + 4x. Assume that the total number of observations is n = 20. In addition, the explained sum of squares is SSE = 10 and the residual sum of squares is SSR = 30. Under the classical Gauss-Markov assumptions, a) What is the value of the R2 ?