4. Can the speed of a vehicle be predicted by the age of its driver? The speeds Y (in km/h) of a sample of ten vehicles are recorded, along with the ages X of their drivers. From the data, we calculate i = 48.2, ỹ = 107.8, C(z,-2)² = 3669.6, C(v.– û.)² = 752.7. The least squares regression line is calculated to be ŷ = 133.198 – 0.527z. It is also determined that 57.5% of the variation in the speed of a vehicle can be accounted for by its regression on the age of the driver. (a) What is the value of the correlation between the age of a driver and the speed of a vehicle? (b) Provide an interpretation of the slope of the least squares regression line. (c) Calculate a 95% confidence interval for the parameter Bị in the simple linear regression model.
4. Can the speed of a vehicle be predicted by the age of its driver? The speeds Y (in km/h) of a sample of ten vehicles are recorded, along with the ages X of their drivers. From the data, we calculate i = 48.2, ỹ = 107.8, C(z,-2)² = 3669.6, C(v.– û.)² = 752.7. The least squares regression line is calculated to be ŷ = 133.198 – 0.527z. It is also determined that 57.5% of the variation in the speed of a vehicle can be accounted for by its regression on the age of the driver. (a) What is the value of the correlation between the age of a driver and the speed of a vehicle? (b) Provide an interpretation of the slope of the least squares regression line. (c) Calculate a 95% confidence interval for the parameter Bị in the simple linear regression model.

College Algebra
7th Edition
ISBN:9781305115545
Author:James Stewart, Lothar Redlin, Saleem Watson
Publisher:James Stewart, Lothar Redlin, Saleem Watson
Chapter1: Equations And Graphs
Section: Chapter Questions
Problem 10T: Olympic Pole Vault The graph in Figure 7 indicates that in recent years the winning Olympic men’s...

Related questions
Question
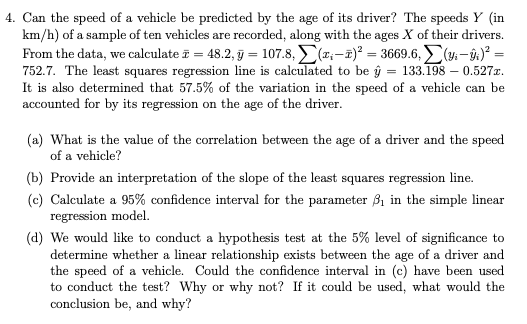
Transcribed Image Text:4. Can the speed of a vehicle be predicted by the age of its driver? The speeds Y (in
km/h) of a sample of ten vehicles are recorded, along with the ages X of their drivers.
From the data, we calculate i = 48.2, j = 107.8, (z:-2)² = 3669.6, (4- û)° =
752.7. The least squares regression line is calculated to be ŷ = 133.198 – 0.527x.
It is also determined that 57.5% of the variation in the speed of a vehicle can be
accounted for by its regression on the age of the driver.
(a) What is the value of the correlation between the age of a driver and the speed
of a vehicle?
(b) Provide an interpretation of the slope of the least squares regression line.
(c) Calculate a 95% confidence interval for the parameter 31 in the simple linear
regression model.
(d) We would like to conduct a hypothesis test at the 5% level of significance to
determine whether a linear relationship exists between the age of a driver and
the speed of a vehicle. Could the confidence interval in (c) have been used
to conduct the test? Why or why not? If it could be used, what would the
conclusion be, and why?
Expert Solution
This question has been solved!
Explore an expertly crafted, step-by-step solution for a thorough understanding of key concepts.

Step by step
Solved in 3 steps with 6 images

Recommended textbooks for you
College Algebra
Algebra
ISBN:
9781305115545
Author:
James Stewart, Lothar Redlin, Saleem Watson
Publisher:
Cengage Learning

Linear Algebra: A Modern Introduction
Algebra
ISBN:
9781285463247
Author:
David Poole
Publisher:
Cengage Learning
College Algebra
Algebra
ISBN:
9781305115545
Author:
James Stewart, Lothar Redlin, Saleem Watson
Publisher:
Cengage Learning
Linear Algebra: A Modern Introduction
Algebra
ISBN:
9781285463247
Author:
David Poole
Publisher:
Cengage Learning