For each of the following scenarios, indicate whether the relationship between the two variables is positive or negative, as well as which line on the previous graph has a slope that reflects this type of relationship. Hint: The X-axis and Y-axis on the graph are not labeled intentionally. You need to substitute the variables from each scenario for the horizontal and vertical axis. For example, in the first scenario, X-axis should be labeled " The average grade received" and Y-axis should be labeled "The number of hours spent studying". Scenario As the number of hours spent watching TV rises, the average grade received falls. As the number of hours spent studying rises, the average grade received rises. As the number of hours spent studying falls, the likelihood of getting an A falls. True or False: Line B has a slope of infinity. O True O False Relationship Line The following graphs show the relationship between the price of apples and the quantity of apples supplied in two different regions, the North and the and South. Assume that the two lines are parallel. 1 (?)
For each of the following scenarios, indicate whether the relationship between the two variables is positive or negative, as well as which line on the previous graph has a slope that reflects this type of relationship. Hint: The X-axis and Y-axis on the graph are not labeled intentionally. You need to substitute the variables from each scenario for the horizontal and vertical axis. For example, in the first scenario, X-axis should be labeled " The average grade received" and Y-axis should be labeled "The number of hours spent studying". Scenario As the number of hours spent watching TV rises, the average grade received falls. As the number of hours spent studying rises, the average grade received rises. As the number of hours spent studying falls, the likelihood of getting an A falls. True or False: Line B has a slope of infinity. O True O False Relationship Line The following graphs show the relationship between the price of apples and the quantity of apples supplied in two different regions, the North and the and South. Assume that the two lines are parallel. 1 (?)

Chapter1: Introducing The Economic Way Of Thinking
Section1.A: Applying Graphics To Economics
Problem 9SQ

Related questions
Question
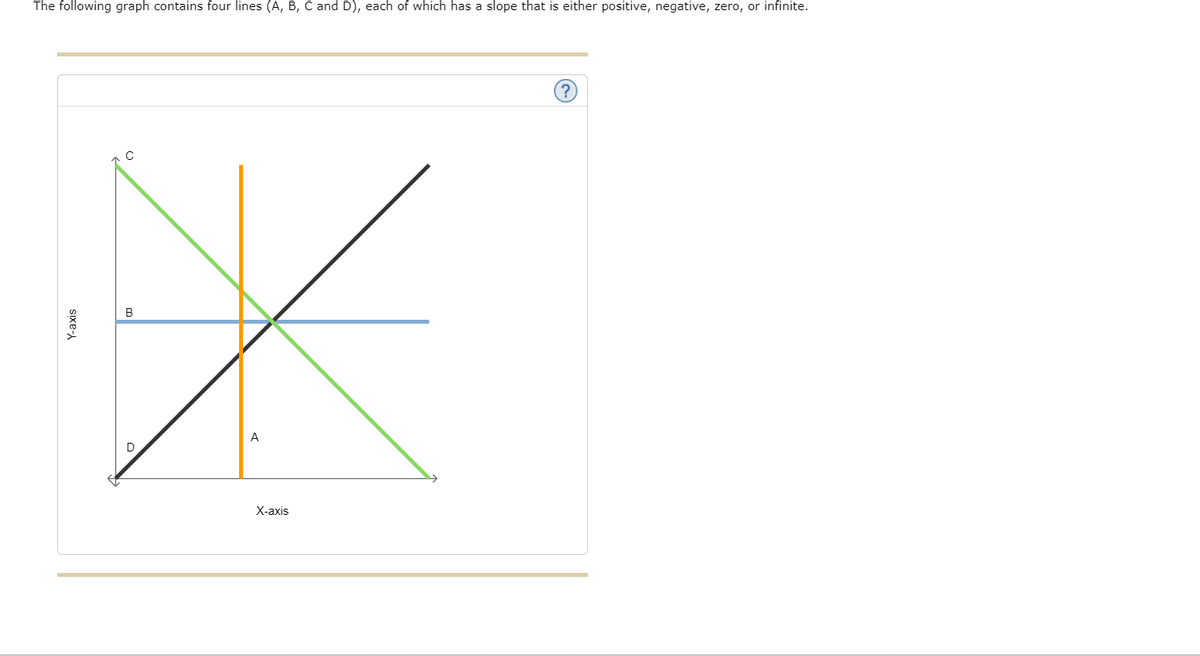
Transcribed Image Text:The following graph contains four lines (A, B, C and D), each of which has a slope that is either positive, negative, zero, or infinite.
Y-axis
с
B
X
A
D
X-axis
?
Transcribed Image Text:For each of the following scenarios, indicate whether the relationship between the two variables is positive or negative, as well as which line on the
previous graph has a slope that reflects this type of relationship.
Hint: The X-axis and Y-axis on the graph are not labeled intentionally. You need to substitute the variables from each scenario for the horizontal and
vertical axis. For example, in the first scenario, X-axis should be labeled " The average grade received" and Y-axis should be labeled "The number of
hours spent studying".
Scenario
As the number of hours spent watching TV rises, the average grade received falls.
As the number of hours spent studying rises, the average grade received rises.
As the number of hours spent studying falls, the likelihood of getting an A falls.
True or False: Line B has a slope of infinity.
O True
O False
Relationship
Line
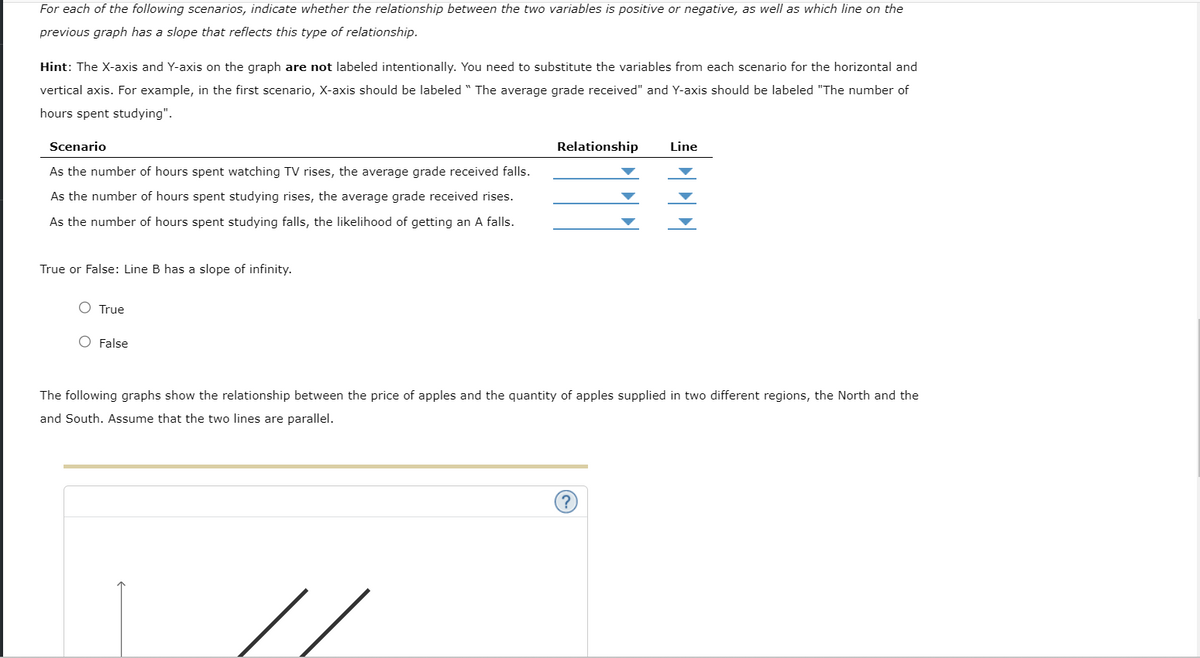
The following graphs show the relationship between the price of apples and the quantity of apples supplied in two different regions, the North and the
and South. Assume that the two lines are parallel.
Expert Solution
This question has been solved!
Explore an expertly crafted, step-by-step solution for a thorough understanding of key concepts.

This is a popular solution!

Trending now
This is a popular solution!

Step by step
Solved in 3 steps

Knowledge Booster


Learn more about
Need a deep-dive on the concept behind this application? Look no further. Learn more about this topic, economics and related others by exploring similar questions and additional content below.Recommended textbooks for you


Microeconomics: Principles & Policy
Economics
ISBN:
9781337794992
Author:
William J. Baumol, Alan S. Blinder, John L. Solow
Publisher:
Cengage Learning
