For each scenario below, choose the graph that gives the best representation. (a) The population of a large city grows very quickly for several years. Then the growth begins to slow, and the population remains constant for several years. After this, the population grows again, but slower than before. Population Population Population Population Time Time Time Time (b) Jane stands on a high dive platform for several seconds. Then she dives into the pool and swims around. She then climbs back up toward the high dive platform. Jane's Jane's Jane's Jane's Distance Distance Distance Distance Above Above Above Above the the the the Pool Pool Pool Pool Time Time Time Time
For each scenario below, choose the graph that gives the best representation. (a) The population of a large city grows very quickly for several years. Then the growth begins to slow, and the population remains constant for several years. After this, the population grows again, but slower than before. Population Population Population Population Time Time Time Time (b) Jane stands on a high dive platform for several seconds. Then she dives into the pool and swims around. She then climbs back up toward the high dive platform. Jane's Jane's Jane's Jane's Distance Distance Distance Distance Above Above Above Above the the the the Pool Pool Pool Pool Time Time Time Time

Elementary Geometry For College Students, 7e
7th Edition
ISBN:9781337614085
Author:Alexander, Daniel C.; Koeberlein, Geralyn M.
Publisher:Alexander, Daniel C.; Koeberlein, Geralyn M.
ChapterP: Preliminary Concepts
SectionP.CT: Test
Problem 1CT

Related questions

Question
Transcribed Image Text:earn
awa.aleks.com/alekscgi/x/Isl.exe/1o_u-lgNslkr7j8P3jH-IJIZWFZROQitl_6UNOVYW-9SlqaGlkcW6AGQbSylWqEf2BjUonZ2yspfsiJWNcyjHqDf9Ei1Ck4IGM9Vx7THXJcCHwLR7Gw2?1d
MATH AND PHYSICS
Choosing a graph to fit a narrative: Advanced
Mitche
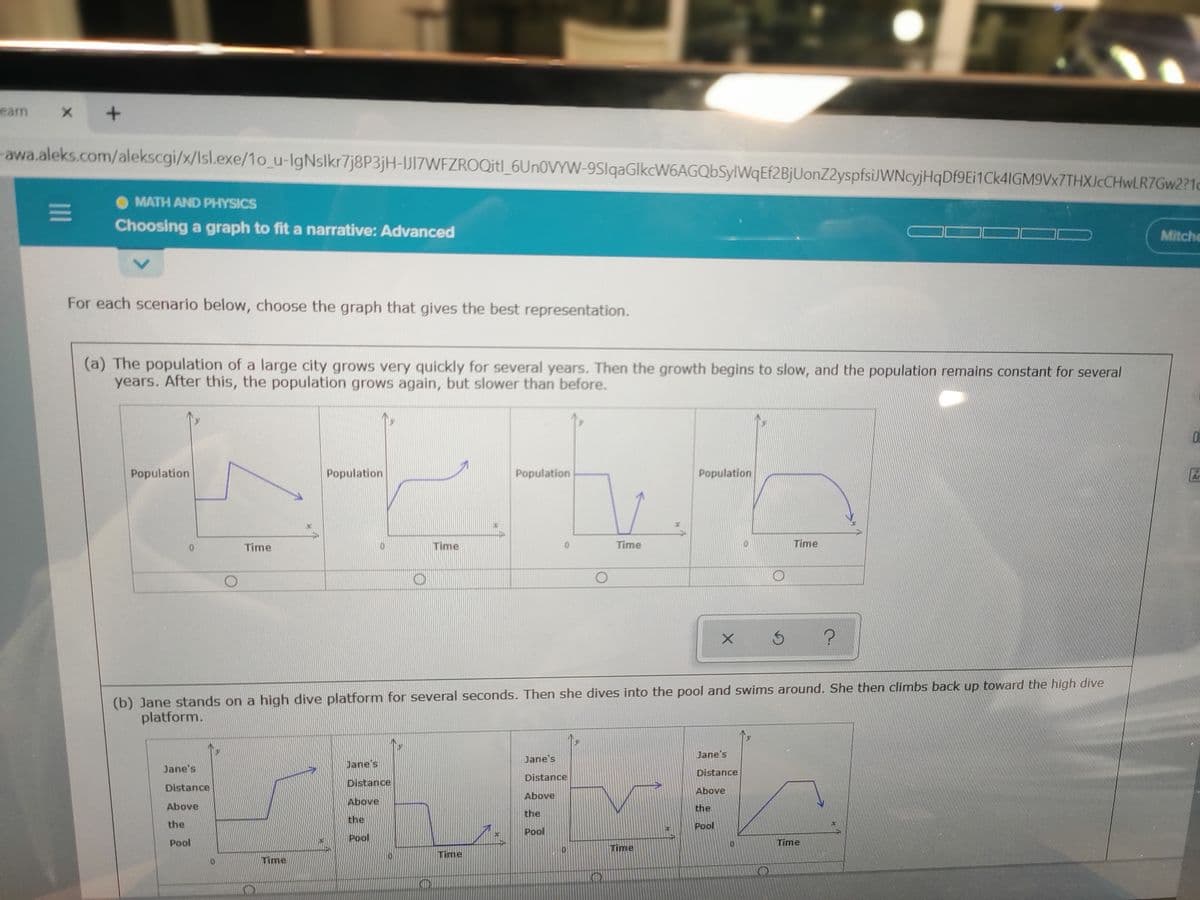
For each scenario below, choose the graph that gives the best representation.
(a) The population of a large city grows very quickly for several years. Then the growth begins to slow, and the population remains constant for several
years. After this, the population grows again, but slower than before.
Population
Population
Population
Population
Ar
Time
Time
Time
Time
(b) Jane stands on a high dive platform for several seconds. Then she dives into the pool and swims around. She then climbs back up toward the high dive
platform.
Jane's
Jane's
Jane's
Jane's
Distance
Distance
Distance
Distance
Above
Above
Above
Above
the
the
the
the
Pool
Pool
Pool
Pool
Time
Time
Time
Time
II
Expert Solution
This question has been solved!
Explore an expertly crafted, step-by-step solution for a thorough understanding of key concepts.

This is a popular solution!

Trending now
This is a popular solution!

Step by step
Solved in 3 steps

Knowledge Booster


Learn more about
Need a deep-dive on the concept behind this application? Look no further. Learn more about this topic, geometry and related others by exploring similar questions and additional content below.Recommended textbooks for you
Elementary Geometry For College Students, 7e
Geometry
ISBN:
9781337614085
Author:
Alexander, Daniel C.; Koeberlein, Geralyn M.
Publisher:
Cengage,

Elementary Geometry for College Students
Geometry
ISBN:
9781285195698
Author:
Daniel C. Alexander, Geralyn M. Koeberlein
Publisher:
Cengage Learning
Elementary Geometry For College Students, 7e
Geometry
ISBN:
9781337614085
Author:
Alexander, Daniel C.; Koeberlein, Geralyn M.
Publisher:
Cengage,
Elementary Geometry for College Students
Geometry
ISBN:
9781285195698
Author:
Daniel C. Alexander, Geralyn M. Koeberlein
Publisher:
Cengage Learning