For the above data: Showing all work: [and accounting for outliers] A) Calculate the mean B) Calculate the deviation of each value from the mean C) Calculate the mean of the deviations


Q: d. Describe how any outlier affects the mean and the standard deviation
A: If X1, X2, ..., Xn are n observations in an experiment, Mean=1n∑i=1nxiStandard…
Q: The five-number summary for a dataset on Exam Scores is given in the table below. Using this…
A: Since 73.6 is the Q3, it implies that 75% observations are less than 73.6. Thus percentage of…
Q: The mean can be thought of as the balancing point of a distribution. According to this description,…
A: Mean A mean is the simple mathematical average of a set of two or more numbers. The mean…
Q: Illustration 79 Using the method of ordinates fit a normal curve to the following data, 10 -14 15–…
A:
Q: The distribution of the heights (in inches) of 18-year-old U.S. females has first quartile Q₁ =…
A: The provided information is Q1=62Q3=66
Q: For the following data obtain (i) mean, (ii) median, (iii) mean deviation from median, and (iv) the…
A:
Q: interpret results. Further state the nature of the distribution of each variable in table No.06…
A: Given, A table of output of statistical suummary for distributions. To find, Further state the…
Q: For the data given, as the confidence leel increased from 95% to 99% did the margin of error…
A: We have given that a random sample of eye colours collected from a group of 40 MVCC students.
Q: 2. For the data in the table below, find the sum of the absolute deviations for the predicted values…
A: Given observation x y ypred =3.6x-0.4 |y-ypred| 1 3 3.2 0.2 2 7 6.8 0.2 3 9 10.4 1.4 4…
Q: The population Mean is 125 with a st dev of 22.However , the population distribtuon is skewed to the…
A:
Q: Calculate the coefficient of variation t
A: Our aim is to find the coefficient of variation. From the given data : n=5 , ƩX=140 , ƩX2=4038
Q: Based on this graph what was the approximate distribution of the averages? X~___(___,___)
A: Central limit theorem (CLT): According to CLT, for a given sufficiently large sample size from a…
Q: The line plot shows the surface area, in square feet, of the nine desks sold by Matt's Furniture…
A: Modulus of any number is always positive. i. e., |-a| = a where, a = all real numbers.
Q: Given the interval estimate for the mean (6.2, 17.6), the point estimate for the mean is
A: Solution: From the given information, the interval estimate for the mean is (6.2, 17.6).
Q: Given the interval estimate for the mean (9.2, 18.8), the point estimate for the mean is and the…
A: The given interval estimate for the mean is (9.2, 18.8).
Q: Given the interval estimate for the mean (6.2, 17.6), the point estimate for the mean is , and the…
A: Given information- We have given the confidence interval estimate for the mean = (6.2, 17.6) We have…
Q: The data presented below represents the bursting strength in pounds per square inch (psi) of 100…
A: Descriptive Statistics: summary given below:
Q: Given the interval estimate for the mean (5.2, 14.4), the point estimate for the mean is and the…
A:
Q: The table below shows the observed pollution indexes of air samples in two areas of a city. Test the…
A: Null and alternative hypothesis: Given data represents the observed pollution indexes of air samples…
Q: The sample mean x (with a bar above) is the best point estimator of the sample mean u(mu) True or…
A: Sample mean: The sum of the all observations of sample divided by the total number of observations…
Q: isn't it should use the normal table to find z value?
A:
Q: Approximate the median for following GFDT. (Report answer as the midpoint of the class containing…
A: The given data set with cumulative frequencies is as follows Data Frequency Cumulative frequency…
Q: Calculate the average (mean) of the data shown, to two decimal places x 14.9 18.2 15.9 14.5 24.1…
A: A set of data values is given. We need to find the average (mean) The solution to the given question…
Q: Using a spectrophotometric analytical technique, the glucose concentrations in a patient with mildly…
A: Given that The data are 16.67, 16.66, 16.64, 16.30, 16.31, 16.70
Q: The estimate of the standard error of the mean is computed as?
A:
Q: Illustration1. Find the interquartile range and the coefficient of quartile deviation from the…
A: Here we have Q1=10 Q3 is 40 so interquartile range is define as thw difference between third and…
Q: Given the interval estimate for the mean (8.2, 18.6), the point estimate for the mean is and the…
A: Obtain the value of the point estimate of mean. The value of the point estimate of mean is…
Q: The five-number summary for a dataset on Batting Average is given in the table below. Using this…
A: Given five number summary is: Min = 0.209 Q1 = 0.248 Median = 0.252 Q3 = 0.297 Max = 0.303
Q: The data below are concerning the concentration of thiol in the blood lysate. 1.84 1.92 1.94 1.92…
A: A) The data below are concerning the concentration of thiol in the blood lysate. 1.84 1.92 1.94 1.92…
Q: given the data distribution is aproximately normal with the minimum value of 25 and the maximum…
A:
Q: The Highway Patrol, using radar, checked the speeds (in mph) of 30 passing motorists at a…
A: Given data : 1, 35, 35, 36, 36, 37, 38, 38, 39, 40, 40, 41, 41, 41, 42, 42, 43, 43, 43, 44, 45, 45,…
Q: Given the interval estimate for the mean (8.2, 11.4), the point estimate for the mean is and the…
A: Given information- We have given the confidence interval estimate for the mean = (8.2, 11.4) We have…
Q: Given the interval estimate for the mean (5.2, 17.8), the point estimate for the mean and the margin…
A: Given, The interval estimate is (5.2,17.8)
Q: According to the Distribution of Z table, ______________ % of area is below a Z value of -1.16?
A: Z value = -1.16 Percentage of area that is below a Z value of -1.16 is given as,
Q: For the periods 2014 to 2019, ESKOM’s electricity percentage price adjustments are given in the…
A: We have to calculate geometric mean, We have to compare geometric mean with average. Geometric Mean…
Q: Given the interval estimate for the mean (9.8, 17.8), the point estimate for the mean is and the…
A: Give that Interval estimate for the Mean (9.8 , 17.8) Lower limit = 9.8 Upper limit = 17.8 We…
Q: The ratio of the mode of this distribution to the median is:
A:
Q: The first step in finding the interquartile range involves calculating the ____ of the data set. a.…
A: Solution-: The first step in finding the interquartile range involves calculating the ____ of the…
Q: Consider the following scatter and residual plots:
A: Correlation is a relationship that is quantitative in nature and is being measured in terms of…
Q: Based on this graph what is the approximate distribution of data? X~___(___,___)
A: From the data given,we try to create the histogram of the data.
Q: The table provides the number of Facebook friends for a sample of 50 people aged 18 to 25. a)…
A: The given table provides the number of Facebook friends for a sample of 50 people aged 18 to 25.…
Q: d. Compute the sample correlation coefficient between the number of defective parts found and the…
A: 1) Solution: Let x =Line Speed and y = Number of defective parts x y xy x^2 y^2 20 21 420…
Q: For the following data obtain () mean, (ii) median, (i) mean deviation from median, and (iv) the…
A:
Q: The figure above shows three different panels examining the relationship between average price and…
A: Panel A compares two box plot for the average prices of the two types of avocado. It can be observed…
Q: Given the interval estimate for the mean (5, 15), the point estimate for the mean is ________, and…
A: Solution: From the given information, the interval estimate of the mean is (5, 15). Then, the point…
Q: For which distribution shape is it usually appropriate to use the median when summarizing the data?…
A: When data is skewed, the median is appropriate to give value.
Q: Refer to the data below. 38 42 26 22 30 42 36 42 Which measure of dispersion in a data set is…
A:
Q: following sample of n= 10 scores: 2,3,4,4,5,5,5,6,6,7. assume that the scores are measurements of a…
A: In an ordered (ascending/descending) data set, the formula to find the median is as follows:
Q: The table below shows the observations made on the colours of vehicle red blue white grey red red…
A: Tabulate the data in the form: Color Frequency, f Red 8 Blue 2 White 4 Grey 3 Yellow 3…
Q: Given the interval estimate for the mean (9.2, 13.4), the point estimate for the mean is _______ ,…
A: The given interval estimate for the mean is (9.2, 13.4).The margin of error is calculated below:
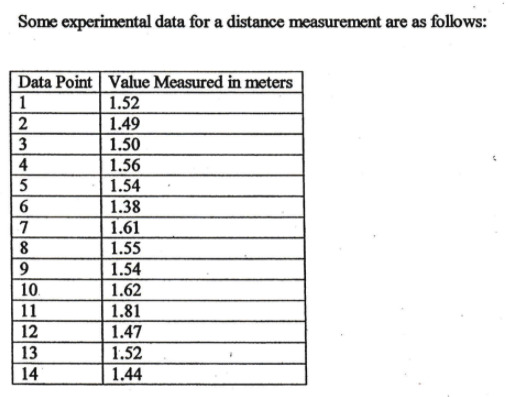
![For the above data: Showing all work: [and accounting for outliers]
A) Calculate the mean
B) Calculate the deviation of each value from the mean
C) Calculate the mean of the deviations
D) Calculate the standard deviation
E) Calculate the standard deviation of the mean
F) Calculate the absolute uncertainty
G) Calculate the fractional uncertainty
H) Calculate the percentile uncertainty](/v2/_next/image?url=https%3A%2F%2Fcontent.bartleby.com%2Fqna-images%2Fquestion%2F2fc06c43-f7fc-4cef-a2f7-c3aa8fd8ec0e%2Ff3cefdc2-6fd2-4241-9479-45b185f78877%2Fwyqaxw_processed.png&w=3840&q=75)
Note: Since you have posted a question with multiple subparts, we will solve the first three subparts for you. To get the remaining subparts solved, please repost the complete question and mention the subparts to be solved.

Step by step
Solved in 4 steps


- Read the metric vernier depth gage measurement for this setting.The following data shows the measured distance between A and B. Determine the Most probable distance between A and B.The following data represent the muzzle velocity (in feet per second) of rounds fired from a 155-mm gun. For each round, two measurements of the velocity were recorded using two different measuring devices, resulting in the following data. Complete parts (a) through (d) below. Observation 1 2 3 4 5 6 A 791.7 791.7 794.2 792.1 792.5 792.3 B 800.2 788.4 797.7 791.5 800.4 789.6 1. Why are these matched-pairs data? A.Two measurements (A and B) are taken on the same round. B.The same round was fired in every trial. C. The measurements (A and B) are taken by the same instrument. D. All the measurements came from rounds fired from the same gun. b) Is there a difference in the measurement of the muzzle velocity between device A and device B at the α=0.01 level of significance? Note: A normal probability plot and boxplot of the data indicate that the differences are approximately normally…
- The following data represent the muzzle velocity (in feet per second) of rounds fired from a 155-mm gun. For each round, two measurements of the velocity were recorded using two different measuring devices, resulting in the following data. Complete parts (a) through (d) below. Observation 1 2 3 4 5 6 A 790.2 790.2 793.3 793.3 791.6 791.6 793.9 793.9 794.7 794.7 793.1 793.1 B 794.8 794.8 789.0 789.0 796.2 796.2 793.5 793.5 802.9 802.9 791.3 791.3 (a) Why are these matched-pairs data? A. All the measurements came from rounds fired from the same gun. B. Two measurements (A and B) are taken on the same round. Your answer is correct. C. The measurements (A and B) are taken by the same instrument. D. The same round was fired in every trial. (b) Is there a difference in the measurement of the muzzle velocity between device A and device B at the alpha equals 0.01 α=0.01 level of significance? Note: A normal probability…Please, find Geomatric Mean of the given data. ASAP Marks 10-19 20-29 30-39 40-49 50-59 Number of students 05 25 40 20 10The following data represent the muzzle velocity (in feet per second) of rounds fired from a 155-mm gun. For each round, two measurements of the velocity were recorded using two different measuring devices, resulting in the following data. Complete parts (a) through (d) below. Observation 1 2 3 4 5 6 A 790.2 793.3 791.6 793.9 794.7 793.1 B 794.8 789.0 796.2 793.5 802.9 791.3 (a) Why are these matched-pairs data? A. All the measurements came from rounds fired from the same gun. B. Two measurements (A and B) are taken on the same round. C. The measurements (A and B) are taken by the same instrument. D. The same round was fired in every trial. (b) Is there a difference in the measurement of the muzzle velocity between device A and device B at the α=0.01level of significance? Note: A normal probability plot and boxplot of the data indicate that the differences are…
- Please, find the Geomatric Mean of the given data. ASAP Monthly rent less than (Rs.) 10 20 30 40 50 60 70 80 Number of families 03 08 16 26 37 50 56 60The following data represent the muzzle velocity (in feet per second) of rounds fired from a 155-mm gun. For each round, two measurements of the velocity were recorded using two different measuring devices, resulting in the following data. Complete parts (a) through (d) below. Observation 1 2 3 4 5 6 A 790.4 790.7 790.2 792.8 794.3 792.3 B 792.9 786.3 797.9 790.7 803.6 787.5 (a) Why are these matched-pairs data? A. All the measurements came from rounds fired from the same gun. B. Two measurements (A and B) are taken on the same round. Your answer is correct. C. The same round was fired in every trial. D. The measurements (A and B) are taken by the same instrument. (b) Is there a difference in the measurement of the muzzle velocity between device A and device B at the α=0.01 level of significance? Note: A normal probability plot and boxplot of the data indicate that the…The following data represent the muzzle velocity (in feet per second) of rounds fired from a 155-mm gun. For each round, two measurements of the velocity were recorded using two different measuring devices, resulting in the following data. Complete parts (a) through (d) below. Observation 1 2 3 4 5 6 A 792.6 792.8 791.1 791.9 790.8 790.5 B 796.7 790.5 793.9 790.6 799.7 789.7 (a) Why are these matched-pairs data? A. The same round was fired in every trial. B. All the measurements came from rounds fired from the same gun. C. The measurements (A and B) are taken by the same instrument. D. Two measurements (A and B) are taken on the same round. Your answer is correct. (b) Is there a difference in the measurement of the muzzle velocity between device A and device B at the α=0.01 level of significance? Note: A normal probability plot and boxplot of the data indicate that the…
- If we have measured the variable "feelings towards same-sex marriage" with results of strongly support, undecided, or strongly oppose, then the level of measurement in this case is: Select one: A. Ordinal B. Nominal C. Interval/RatioConsider the following ordered data. 2 5 5 6 7 7 8 9 10 (a) Find the low, Q1, median, Q3, and high. low Q1 median Q3 high (b) Find the interquartile range.(c) Make a box-and-whisker plot.Consider the following ordered data. 2 5 5 6 7 7 8 9 10 (a) Find the low, Q1, median, Q3, and high. low Q1 median Q3 high (b) Find the interquartile range.
