For the data and sample regression equation shown below, complete parts (a) through (c). 0 2 7 7 y=4.524-0.801x 5 2 X y 6₁ 0 -3 1 a. Determine the standard error of the estimate. b. Construct a residual plot. c. Construct a normal probability plot of the residuals. Click the icon to view the table of normal scores. a. The standard error of the estimate (Round to three decimal places as needed.)
For the data and sample regression equation shown below, complete parts (a) through (c). 0 2 7 7 y=4.524-0.801x 5 2 X y 6₁ 0 -3 1 a. Determine the standard error of the estimate. b. Construct a residual plot. c. Construct a normal probability plot of the residuals. Click the icon to view the table of normal scores. a. The standard error of the estimate (Round to three decimal places as needed.)

Chapter4: Linear Functions
Section: Chapter Questions
Problem 30PT: For the following exercises, use Table 4 which shows the percent of unemployed persons 25 years or...

Related questions
Question
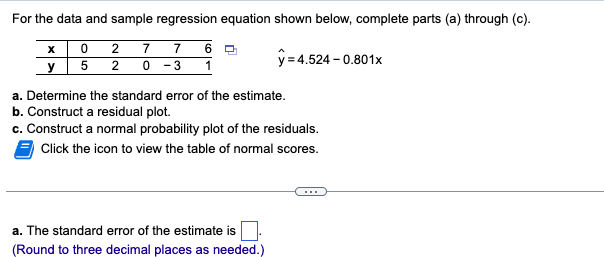
Transcribed Image Text:For the data and sample regression equation shown below, complete parts (a) through (c).
0 2 7 7
y=4.524-0.801x
5 2
X
y
6₁
0 -3 1
a. Determine the standard error of the estimate.
b. Construct a residual plot.
c. Construct a normal probability plot of the residuals.
Click the icon to view the table of normal scores.
a. The standard error of the estimate
(Round to three decimal places as needed.)
Expert Solution
This question has been solved!
Explore an expertly crafted, step-by-step solution for a thorough understanding of key concepts.

Step by step
Solved in 6 steps with 6 images

Recommended textbooks for you

Glencoe Algebra 1, Student Edition, 9780079039897…
Algebra
ISBN:
9780079039897
Author:
Carter
Publisher:
McGraw Hill

Functions and Change: A Modeling Approach to Coll…
Algebra
ISBN:
9781337111348
Author:
Bruce Crauder, Benny Evans, Alan Noell
Publisher:
Cengage Learning
Glencoe Algebra 1, Student Edition, 9780079039897…
Algebra
ISBN:
9780079039897
Author:
Carter
Publisher:
McGraw Hill
Functions and Change: A Modeling Approach to Coll…
Algebra
ISBN:
9781337111348
Author:
Bruce Crauder, Benny Evans, Alan Noell
Publisher:
Cengage Learning