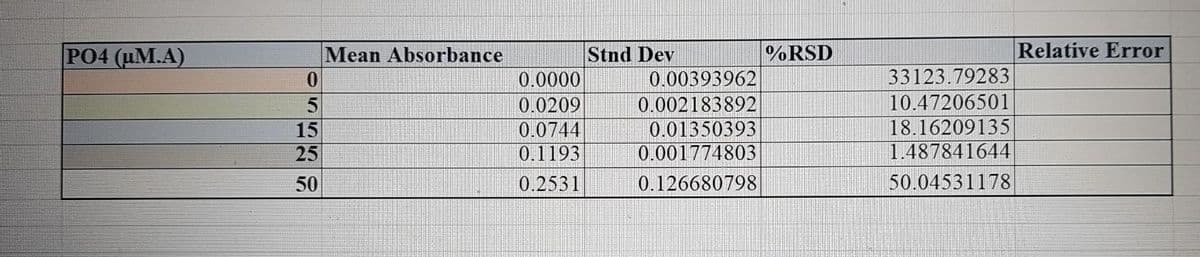
what is the relative error of this data ? Please do in excel and show the formula you applied.


Q: 7 8 9 According to the given information below, find answers question number 6 through question…
A: Hypothesis test are used to compare the sample and population. Hypothesis is the statement of…
Q: 1 out of 500 randomly selected fish from Lake One are poisoned, while 28 out of 600 randomly…
A: We have to find confidence interval for difference in proportion. Formula : CI…
Q: Given in the table are the BMI statistics for random samples of men and women. Assume that the two…
A: It is given that 0.05 significance level for both parts.
Q: b) Drivers were surveyed to determine their rest time taken at the Rest & Recreation (R&R) area when…
A: Mean of the time taken by each driver to stop at the R&R is 30.6 minutes. Standard deviation…
Q: a) Calculate the regression equation for height of son upon height of father. b) When the…
A: From given data : n=8 Height of Father (x) height of son (y) x-x y-y (x-x)2 (y-y)(x-x) 170 172…
Q: items produced 3. In the past the average proportion of by a certain process has been 3 per cent and…
A: Given that, p¯=0.03 Sample size, n is 30
Q: Determine whether the statement is true or false. If it is false, rewrite it as a true statement. In…
A: The hypothesis is the statement regarding the parameter. There are two types of hypothesis- null and…
Q: Answer the questions below. (a) A computer manufacturer conducted a survey. It showed that a younger…
A: Correlation is a measure that indicates the association or relationship between two variables. The…
Q: Suppose that it is known that in a certain community 30% of the households have a micro-wave ovens.…
A: Given: Population proportion p = 30% p = 0.30 Sample size n = 19 Formula Used: Standard deviation =…
Q: B. t
A: Level of significance is 0.10 and sample size is n= 19. Here the test is two tailed. Critical values…
Q: Question 2 y=ax+b a=6.992 b=38.9 Use this to predict the final exam score of a student who s answer…
A:
Q: (a) Find the five-number summary, and (b) draw a box-and-whisker plot of the data. 38 85 2987…
A: Given data is3,8,8,5,2,9,8,7,9,6,9,4,1,6,2,9,8,7,7,9sample size(n)=20
Q: Out of 1000 residents of Eagle County surveyed, 590 of them feel that their children receive a good…
A: There are two independent samples which are Eagle County and Beaver County. We have to construct 95%…
Q: A manufacturer has to take a decision on what length of slabs to manufacture. What length would you…
A: First we have to find the frequency distribution : so, Length between 1.0 and 1.5 = 50-48 = 2…
Q: Government funding: The following table presents the budget (in millions of dollars) for selected…
A: Correlation Coefficient: Correlation tells the connection between two variables that do not have a…
Q: The local pilots association examined records from this year's census of its members. Miguel is a…
A: Given that Mean = 3260 Standard deviation = 865 X = 3375
Q: Given P(A)=0.4P(A)=0.4, P(B)=0.66P(B)=0.66 andand P(A∩ B)=0.374P(A∩B)=0.374, find the value of P(A…
A: Probability is the measurement of event occurrence. It take values positive value and does not…
Q: Find the critical value(s) and rejection region(s) for the indicated t-test, level of significance…
A: Given that α = 0.10 , n = 17 , Two-tailed test
Q: Use the value of the linear correlation coefficient to calculate the coefficient of determination.…
A: The linear correlation coefficient is r = 0.692.
Q: The following data set shows the entrance exam score (Verbal GMAT) for each of eight MBA students…
A: Given data is GMAT 320 290 270 280 340 270 310 310 GPA 3.8 3.1 3.1 3.2 3.8 3.1 3.8 2.9
Q: 3 Salaries of college and non-college graduates were compared. Results are shown below: Educ Level…
A: Chi square test are used to determine the independency between the variable. Chi square test use…
Q: The number of credits being taken by a sample of 13 full-time college students are listed below.…
A: Given information: 8 10 11 11 8 7 7 7 9 7 7 7 8
Q: s] Suppose X and Y are two jointly distributed random variables (in Part A, feel free to assume…
A: By the definition of covariance we know, Cov(X,Y) = E[(X-E(X)) (Y-E(Y)] = E[XY - XE(Y) - YE(X) +…
Q: The effectiveness of a blood-pressure drug is being investigated. An experimenter finds that, on…
A:
Q: Do d, e, f.
A: Given data: x y 34.7 1.89 36 2.03 29.3 1.44 40.1 2.83 35.7 3.09 42.4 3.82 40.3 3.26…
Q: A manufacturing process produces semiconductor chips with a known failure rate of 7.4%. If a random…
A:
Q: On the distant planet Cowabunga , the weights of cows have a normal distribution with a mean of 526…
A:
Q: population
A:
Q: can you solve this question for me by showing it step by step for calculations? Some Tomato plants…
A:
Q: bpm. For a random sample of 151 adult males, the mean pulse rate is 67.4 bpm and the standard…
A:
Q: (c) X = {Bora Bora, Santorini, Bali, Majorca, Capri} is the set of all five items. (i) How many…
A: One can select m items from n items in nCm ways when order of the items is not considered. Here we…
Q: A regression model relating , number of salespersons at a branch office, to y, annual sales at the…
A: The question is about regression Given : Coefficient of intercept ( b0 ) = 88 Coefficient of no. of…
Q: 4. What would the sampling distribution of this estimator be? Why?
A: Sampling Distribution: Suppose Y - y1, y2, y3,.... yn is the random sample of size n from an…
Q: Your medical research team is investigating the mean cost of a 30-day supply of a certain heart…
A: Hypothesis Testing: A method of statistical study entitled hypothesis testing involves testing your…
Q: local coach wants to see if training in light rooms or dark rooms impacts athlete performance. With…
A:
Q: The masses, in kilograms, of group of Jessy Bragg's weight loss group are shown. 81, 79, 83, 76, 89,…
A: Mean: The mean of the given numbers, is calculated by dividing the sum of the numbers by the total…
Q: Find the standard deviation, s, of sample data summarized in the frequency distribution table given…
A: The question is about freq. dist. Given : Std. deviation of original data values = 9 To find : 1 )…
Q: A data set includes data from student evaluations of courses. The summary statistics are n=90, x=…
A:
Q: A random sample of 86 SAT scores of students applying for merit scholarships showed an average of…
A: According to the given information in this question We need to find degree of freedom and critical…
Q: According to a 2009 Reader's Digest article, people throw away approximately 11% of what they buy at…
A: According to guidelines we solve first question only when given questions are different.
Q: If one of the pedestrian deaths is randomly selected, find the probability that both the pedestrian…
A: Given data: Pedestrian intoxicated Pedestrian intoxicated Driver intoxicated Yes No Total…
Q: d. 2. M (Round to two decimal places) wer seeds. e. Interpret ²: O There is a 75% chance that the…
A: Hello! As you have posted more than 3 sub parts, we are answering the 3 sub-parts(d, e and f). In…
Q: Determine the following: ● Mean ● Median Mode • Standard deviation Variance ● Class interval 30-34…
A: Given data is Class Interval Frequency 30 - 34 3 35 - 39 6 40 - 44 7 45 - 49 12 50 - 54…
Q: A simple random sample of 100 observations was taken from a large population. The sample mean and…
A: According to the given information in this question We need to find standard error
Q: (b) Briefly give an example each of studies where you can apply (i) stratified sampling and (ii)…
A: 1. (b) Stratified Sampling : It is a probability sampling method in which a large population is…
Q: State whether the standardized test statistic t indicates that you should reject the null…
A: Given,t-critical value(t0)=1.703and the given test is right-tailed test.
Q: Use technology to help you test the claim about the population mean, μ, at the given level of…
A: From the provided information, Sample size (n) = 250 Sample mean (x̄) = 1198.51 Population standard…
Q: According to a 2009 Reader's Digest article, people throw away approximately 11% of what they buy at…
A: “Since you have posted multiple question , we will solve first question for you. To get the…
Q: Elizabeth's school is selling 100 raffle-tickets to raise money for a new gymnasium. The grand-prize…
A: Probability values can't be negative. It takes the values between 0 to 1. If the probability value…
Q: Determine whether the statement is true or false. If it is false, rewrite it as a true statement. In…
A: We have given that In a hypothesis test you assume the alternative hypothesis is true
what is the relative error of this data ? Please do in excel and show the formula you applied.

Step by step
Solved in 2 steps with 1 images

- Z, a local jazz station, has hired you as a research consultant to determine which demographic groups should be the radio station market. In particular, the station believes that there is a difference between men and women in terms of their opinions of jazz music. By randomly sampling men and women from the Houston metropolitan region, you calculate the results in Table 1. You also calculate a gamma of .064 and a chi-square of 1.99 with 2 degrees of freedom from the table. Note that the measure of association (gamma) of .064 indicates a very weak relationship between gender and like of jazz. In a paragraph of at least five to six sentences, discuss whether the percent distribution of the cross-tab, the measure of association, and chi-square supports, or does not support, the station’s hypothesis. Ensure that you mention hypothesis how the IV percent distribution changes in relationship to the DV what level of significance you used, and how the chi-square obtained from the sample…A tubes lifetime for your company's microwave follow an exponential distribution with a mean of 5.6 years. Your sales policy states that each magnetron tube has a two year warranty. What fraction of the tubes should your company plan to replace under warranty?Along with interest rates, life expectancy is a component in pricing financial annuities. Suppose that you know that last year average life expectancy was 77 years for your annuity holders. Now you want to know if your clients this year have a longer life expectancy, on average, so you randomly sample n=20 of your recently deceased annuity holders to see actual age at death. Using a 5% level of significance, test whether or not the new data shows evidence of your annuity holders now live longer than 77 years, on average. The data below are the sample data (in years of life): (78,75,83,81,81,77,78,79,79,81,76,79,77,76,79,81,73,74,78,79) Does this sample indicate that life expectancy has increased? Test an appropriate hypothesis and state your conclusion (use a 5% level of significance). Be sure to check the necessary assumptions and conditions before conducting your test. Construct A 90% confidence interval for the true average age of death for the…
- Annualized percentage return on investment (as compared to the Standard & Poor's 500 Index) for 10 randomly selected stock screeners are reproduced in the table. Complete parts a through c.Cardiovascular Disease Suppose the incidence rate of myocardial infarction (MI) was 5 per 1000 among 45- to 54-year-old men in 2000. To look at changes in incidence over time, 5000 men in this age group were followed for 1 year starting in 2010. Fifteen new cases of MI were found. Suppose that 25% of patients with Mi in 2000 died within 24 hours. This propartion is called the 24-hour case-fatality rate. Of the 15 new MI cases in the preceding study. 5 died within 24 hours. Test whether the 24-hour case- fatality rate changed from 2000 to 2010.The operator of a pumping station has observed that demand for water during early afternoon hours has an approximately exponential distribution with mean 100 cfs (cubic feet per second).a) Find the probability that the demand will exceed 200 cfs during the early afternoon on arandomly selected day.b) What water-pumping capacity should the station maintain during early afternoons sothat the probability that demand will exceed capacity on a randomly selected day isonly .01?
- Abalone Abalones are edible sea snails that include over100 species. A researcher is working with a model thatuses the number of rings in an Abalone’s shell to predictits age. He finds an observation that he believes has beenmiscalculated. After deleting this outlier, he redoes thecalculation. Does it appear that this outlier was exertingvery much influence?An article in Quality Engineering presents viscosity data from a batch chemical process. A sample of these data is in the table. Reading left to right and up to down, draw a time series plot of all the data and comment on any features of the data that are revealed by this plot. Consider that the first 40 observations (the first 4 columns) were generated from a specific process, whereas the last 40 observations were generated from a different process. Does the plot indicate that the two processes generate similar results? Calculate the sample mean and sample variance of the first 40 and the second 40 observations.To seethe effect of a relatively small error in the estimate of the amountof carbon-14 in a sample being dated, consider this hypotheticalsituation: A bone fragment found in central Illinois in the year 2000 contains 17% of its original carbon-14 content. Estimate the year the animal died.
- Suppose the incidence rate of myocardial infarction (MI)was 5 per 1000 among 45- to 54-year-old men in 2000.To look at changes in incidence over time, 5000 men in thisage group were followed for 1 year starting in 2010. Fifteennew cases of MI were found. Q.)Suppose that 25% of patients with MI in 2000 died within24 hours. This proportion is called the 24-hour case-fatalityrate. 7.14 Of the 15 new MI cases in the preceding study,5 died within 24 hours. Test whether the 24-hour casefatality rate changed from 2000 to 2010. 7.15 Suppose we eventually plan to accumulate 50 MIcases during the period 2010–2015. Assume that the24-hour case-fatality rate is truly 20% during this period.How much power would such a study have in distinguishingbetween case-fatality rates in 2000 and 2010–2015 if atwo-sided test with significance level .05 is planned? 7.16 How large a sample is needed in Problem 7.15 toachieve 90% power?A metal company is supplying its product to a manufacturer of washing appliances that has specified that the outside diameter be 0.255 + 0.028 inch. Fifty samples of n = 5 units show that the process is in good statistical control, the diameters are normally distributed, and that μx and σx for the process are 0.260 and 0.02 inch, respectively. a) What percent of the product made by this process is within the specifications? Answer in 2 decimal placesb) If the process variability was reduced by about half (i.e., σx changed to 0.01 inch), what percent of the product made by this process is within the specifications? Answer in 2 decimal places.Suppose the incidence rate of myocardial infarction (MI)was 5 per 1000 among 45- to 54-year-old men in 2000.To look at changes in incidence over time, 5000 men in thisage group were followed for 1 year starting in 2010. Fifteennew cases of MI were found. Suppose that 25% of patients with MI in 2000 died within24 hours. This proportion is called the 24-hour case-fatalityrate. >Suppose we eventually plan to accumulate 50 MIcases during the period 2010–2015. Assume that the24-hour case-fatality rate is truly 20% during this period.How much power would such a study have in distinguishingbetween case-fatality rates in 2000 and 2010–2015 if atwo-sided test with significance level .05 is planned?
