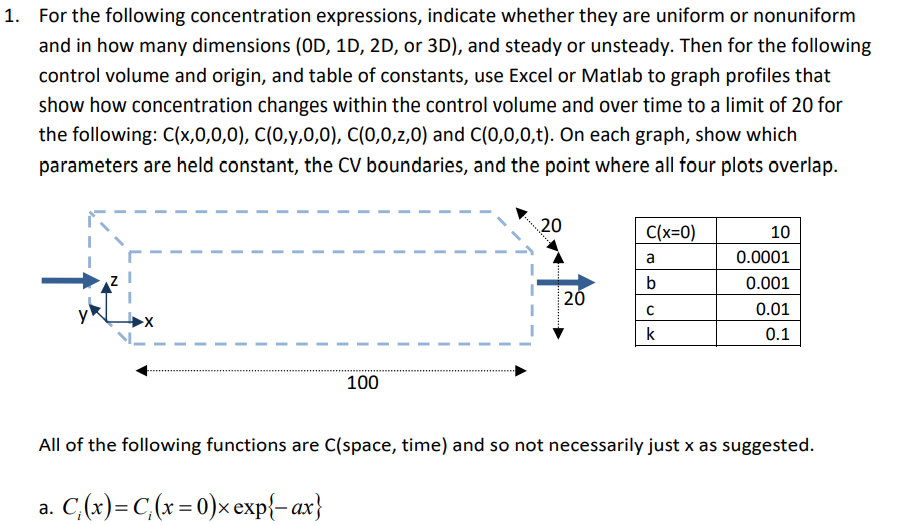
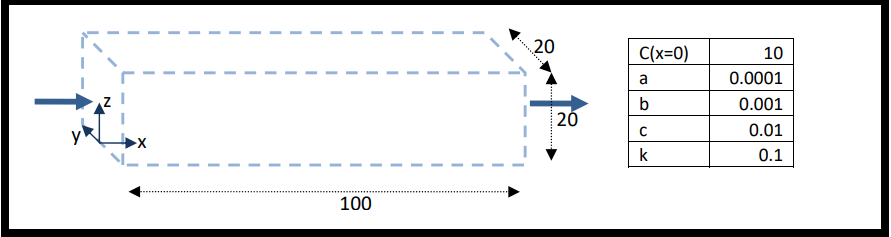
For the following concentration expressions, indicate whether they are uniform or nonuniform and in how many dimensions (OD, 1D, 2D, or 3D), and steady or unsteady. Then for the following control volume and origin, and table of constants, use Excel or Matlab to graph profiles that show how concentration changes within the control volume and over time to a limit of 20 for the following: C(x,0,0,0), C(0,y,0,0), C(0,0,z,0) and C(0,0,0,t). On each graph, show which parameters are held constant, the CV boundaries, and the point where all four plots overlap. 20 C(x=0) 10 a 0.0001 0.001 20 0.01 k 0.1 100 All of the following functions are C(space, time) and so not necessarily just x as suggested.
For the following concentration expressions, indicate whether they are uniform or nonuniform and in how many dimensions (OD, 1D, 2D, or 3D), and steady or unsteady. Then for the following control volume and origin, and table of constants, use Excel or Matlab to graph profiles that show how concentration changes within the control volume and over time to a limit of 20 for the following: C(x,0,0,0), C(0,y,0,0), C(0,0,z,0) and C(0,0,0,t). On each graph, show which parameters are held constant, the CV boundaries, and the point where all four plots overlap. 20 C(x=0) 10 a 0.0001 0.001 20 0.01 k 0.1 100 All of the following functions are C(space, time) and so not necessarily just x as suggested.

Principles of Heat Transfer (Activate Learning with these NEW titles from Engineering!)
8th Edition
ISBN:9781305387102
Author:Kreith, Frank; Manglik, Raj M.
Publisher:Kreith, Frank; Manglik, Raj M.
Chapter5: Analysis Of Convection Heat Transfer
Section: Chapter Questions
Problem 5.18P: The drag on an airplane wing in flight is known to be a function of the density of air (), the...

Related questions
Question
Transcribed Image Text:1. For the following concentration expressions, indicate whether they are uniform or nonuniform
and in how many dimensions (OD, 1D, 2D, or 3D), and steady or unsteady. Then for the following
control volume and origin, and table of constants, use Excel or Matlab to graph profiles that
show how concentration changes within the control volume and over time to a limit of 20 for
the following: C(x,0,0,0), C(0,y,0,0), C(0,0,z,0) and C(0,0,0,t). On each graph, show which
parameters are held constant, the CV boundaries, and the point where all four plots overlap.
20
C(x=0)
10
a
0.0001
b
0.001
| 20
0.01
k
0.1
100
All of the following functions are C(space, time) and so not necessarily just x as suggested.
a. C,(x)= C,(x = 0)x exp{- ax}
Expert Solution
Step 1

Step by step
Solved in 3 steps with 1 images

Knowledge Booster


Learn more about
Need a deep-dive on the concept behind this application? Look no further. Learn more about this topic, mechanical-engineering and related others by exploring similar questions and additional content below.Recommended textbooks for you
Principles of Heat Transfer (Activate Learning wi…
Mechanical Engineering
ISBN:
9781305387102
Author:
Kreith, Frank; Manglik, Raj M.
Publisher:
Cengage Learning
Principles of Heat Transfer (Activate Learning wi…
Mechanical Engineering
ISBN:
9781305387102
Author:
Kreith, Frank; Manglik, Raj M.
Publisher:
Cengage Learning