For the following information, determine whether a normal sampling distribution can be used, where p is the population proportion, a is the level of significance, p is sample proportion, and n is the sample size. If it can be used, test the claim. Claim: p20.34; a = 0.08. Sample statistics: p= 0.30, n = 80 Let q = 1-p and let q = 1-p. A normal sampling distribution be used here, since np 2 5 and nq 2 5. can If a normal sampling distribution can be used, identify the hypotheses for testing the claim. Select the correct choice below and, if necessary, fill in the answer boxe to complete your choice. O A. Ho: p2 , Hg:p< (Round to two decimal places as needed.) О в. Но: р3 (Round to two decimal places as needed.) Question Viewer OC. Ho:p< (Round to two decimal places as needed.) O D. Ho: ps Ha:p> (Round to two decimal places as needed.) Click to select and enter your answer(s) and then click Check Answer. Check Answer
For the following information, determine whether a normal sampling distribution can be used, where p is the population proportion, a is the level of significance, p is sample proportion, and n is the sample size. If it can be used, test the claim. Claim: p20.34; a = 0.08. Sample statistics: p= 0.30, n = 80 Let q = 1-p and let q = 1-p. A normal sampling distribution be used here, since np 2 5 and nq 2 5. can If a normal sampling distribution can be used, identify the hypotheses for testing the claim. Select the correct choice below and, if necessary, fill in the answer boxe to complete your choice. O A. Ho: p2 , Hg:p< (Round to two decimal places as needed.) О в. Но: р3 (Round to two decimal places as needed.) Question Viewer OC. Ho:p< (Round to two decimal places as needed.) O D. Ho: ps Ha:p> (Round to two decimal places as needed.) Click to select and enter your answer(s) and then click Check Answer. Check Answer

Glencoe Algebra 1, Student Edition, 9780079039897, 0079039898, 2018
18th Edition
ISBN:9780079039897
Author:Carter
Publisher:Carter
Chapter10: Statistics
Section10.4: Distributions Of Data
Problem 19PFA

Related questions

Topic Video
Question
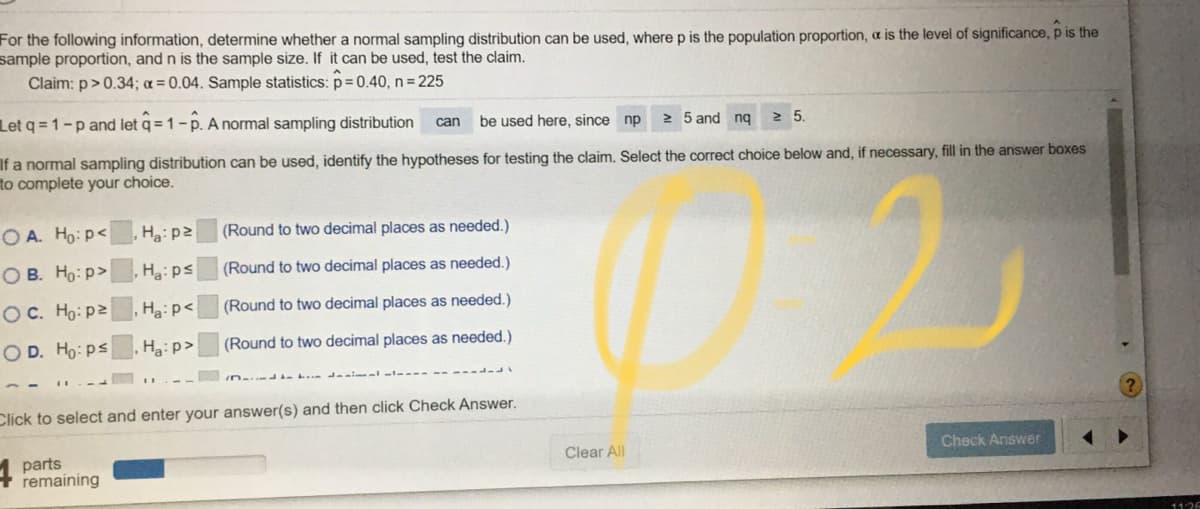
Transcribed Image Text:For the following information, determine whether a normal sampling distribution can be used, where p is the population proportion, a is the level of significance, p is the
sample proportion, and n is the sample size. If it can be used, test the claim.
Claim: p>0.34; a = 0.04. Sample statistics: p=0.40, n = 225
Let q = 1-p and let q = 1-p. A normal sampling distribution
be used here, since np
2 5 and ngq
can
2 5
If a normal sampling distribution can be used, identify the hypotheses for testing the claim. Select the correct choice below and, if necessary, fill in the answer boxes
to complete your choice.
O A. Ho: p<
Ha:p2
(Round to two decimal places as needed.)
ОВ. Но: р>
Ha:ps
(Round to two decimal places as needed.)
OC. Ho: p2
Ha:p<
(Round to two decimal places as needed.)
O D. Ho: ps
Ha:p>
(Round to two decimal places as needed.)
in.. L . danimal
Click to select and enter your answer(s) and then click Check Answer.
parts
remaining
Clear All
Check Answer
11:26
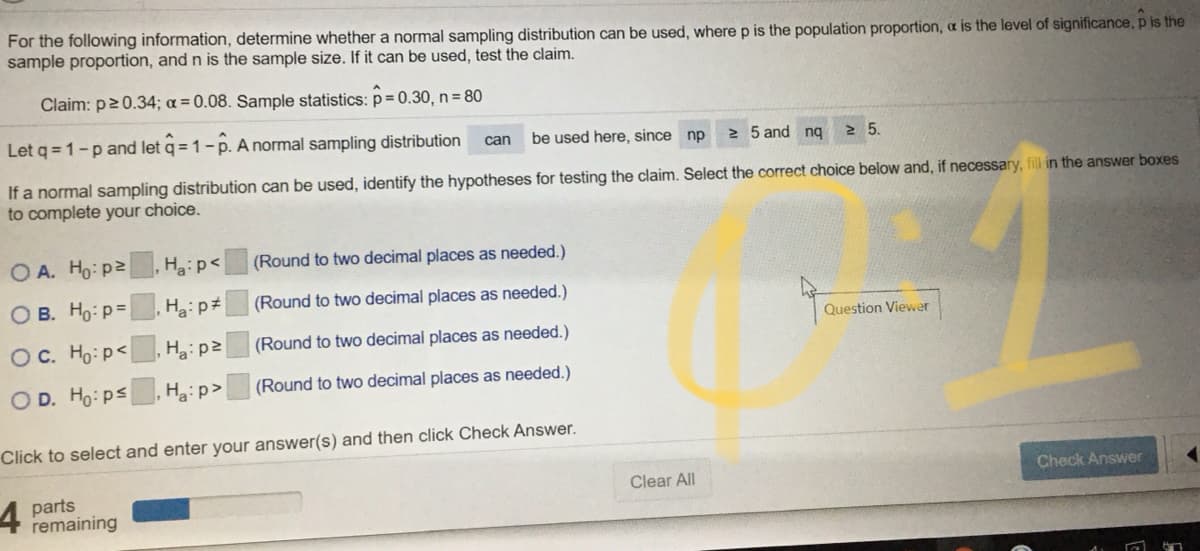
Transcribed Image Text:For the following information, determine whether a normal sampling distribution can be used, where p is the population proportion, a is the level of significance, p is the
sample proportion, and n is the sample size. If it can be used, test the claim.
Claim: p20.34; a = 0.08. Sample statistics: p= 0.30, n = 80
Let q = 1-p and let q = 1 - p. A normal sampling distribution
be used here, since np
2 5 and nq
can
2 5.
If a normal sampling distribution can be used, identify the hypotheses for testing the claim. Select the correct choice below and, if necessary, fill in the answer boxes
to complete your choice.
O A. Ho: p2
Haip<
(Round to two decimal places as needed.)
O B. Ho: p=
(Round to two decimal places as needed.)
Question Viewer
Oc. Ho:p<
Haip2
(Round to two decimal places as needed.)
O D. Ho: ps
Ha:p>
(Round to two decimal places as needed.)
Click to select and enter your answer(s) and then click Check Answer.
Check Answer
4
Clear All
parts
remaining
Expert Solution
This question has been solved!
Explore an expertly crafted, step-by-step solution for a thorough understanding of key concepts.

This is a popular solution!

Trending now
This is a popular solution!

Step by step
Solved in 2 steps

Knowledge Booster


Learn more about
Need a deep-dive on the concept behind this application? Look no further. Learn more about this topic, statistics and related others by exploring similar questions and additional content below.Recommended textbooks for you
Glencoe Algebra 1, Student Edition, 9780079039897…
Algebra
ISBN:
9780079039897
Author:
Carter
Publisher:
McGraw Hill
Glencoe Algebra 1, Student Edition, 9780079039897…
Algebra
ISBN:
9780079039897
Author:
Carter
Publisher:
McGraw Hill