For the following process: Saturated liquid water, initially at 25°C contained inside a tank, is then delivered by a pump at 5 MPa to a heat exchanger. At the heat exchanger inlet, the water temperature is changed to 40°C, and the water is heated isobarically inside the heat exchanger until its temperature at the heat exchanger outlet changes to 330°C. Illustrate the above process by sketching from initial to final state on a T-v diagram complete with the saturation line, pressure curves, and plot the points for each state. Show their axis values on the diagram, and compare all the phases of each state involved in the above process.
For the following process: Saturated liquid water, initially at 25°C contained inside a tank, is then delivered by a pump at 5 MPa to a heat exchanger. At the heat exchanger inlet, the water temperature is changed to 40°C, and the water is heated isobarically inside the heat exchanger until its temperature at the heat exchanger outlet changes to 330°C. Illustrate the above process by sketching from initial to final state on a T-v diagram complete with the saturation line, pressure curves, and plot the points for each state. Show their axis values on the diagram, and compare all the phases of each state involved in the above process.

Elements Of Electromagnetics
7th Edition
ISBN:9780190698614
Author:Sadiku, Matthew N. O.
Publisher:Sadiku, Matthew N. O.
ChapterMA: Math Assessment
Section: Chapter Questions
Problem 1.1MA

Related questions

Question
Transcribed Image Text:Q2
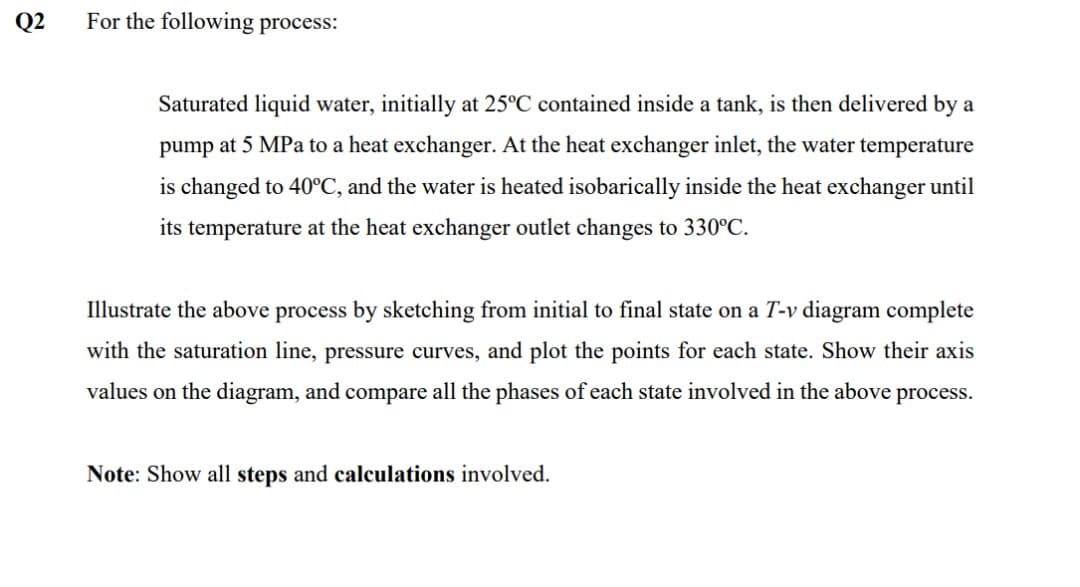
For the following process:
Saturated liquid water, initially at 25°C contained inside a tank, is then delivered by a
pump at 5 MPa to a heat exchanger. At the heat exchanger inlet, the water temperature
is changed to 40°C, and the water is heated isobarically inside the heat exchanger until
its temperature at the heat exchanger outlet changes to 330°C.
Illustrate the above process by sketching from initial to final state on a T-v diagram complete
with the saturation line, pressure curves, and plot the points for each state. Show their axis
values on the diagram, and compare all the phases of each state involved in the above process.
Note: Show all steps and calculations involved.
Expert Solution
This question has been solved!
Explore an expertly crafted, step-by-step solution for a thorough understanding of key concepts.

This is a popular solution!

Trending now
This is a popular solution!

Step by step
Solved in 2 steps with 1 images

Knowledge Booster


Learn more about
Need a deep-dive on the concept behind this application? Look no further. Learn more about this topic, mechanical-engineering and related others by exploring similar questions and additional content below.Recommended textbooks for you
Elements Of Electromagnetics
Mechanical Engineering
ISBN:
9780190698614
Author:
Sadiku, Matthew N. O.
Publisher:
Oxford University Press

Mechanics of Materials (10th Edition)
Mechanical Engineering
ISBN:
9780134319650
Author:
Russell C. Hibbeler
Publisher:
PEARSON

Thermodynamics: An Engineering Approach
Mechanical Engineering
ISBN:
9781259822674
Author:
Yunus A. Cengel Dr., Michael A. Boles
Publisher:
McGraw-Hill Education
Elements Of Electromagnetics
Mechanical Engineering
ISBN:
9780190698614
Author:
Sadiku, Matthew N. O.
Publisher:
Oxford University Press
Mechanics of Materials (10th Edition)
Mechanical Engineering
ISBN:
9780134319650
Author:
Russell C. Hibbeler
Publisher:
PEARSON
Thermodynamics: An Engineering Approach
Mechanical Engineering
ISBN:
9781259822674
Author:
Yunus A. Cengel Dr., Michael A. Boles
Publisher:
McGraw-Hill Education

Control Systems Engineering
Mechanical Engineering
ISBN:
9781118170519
Author:
Norman S. Nise
Publisher:
WILEY

Mechanics of Materials (MindTap Course List)
Mechanical Engineering
ISBN:
9781337093347
Author:
Barry J. Goodno, James M. Gere
Publisher:
Cengage Learning

Engineering Mechanics: Statics
Mechanical Engineering
ISBN:
9781118807330
Author:
James L. Meriam, L. G. Kraige, J. N. Bolton
Publisher:
WILEY