For the histogram shown, choose the statement that is TRUE.

Glencoe Algebra 1, Student Edition, 9780079039897, 0079039898, 2018
18th Edition
ISBN:9780079039897
Author:Carter
Publisher:Carter
Chapter10: Statistics
Section10.6: Summarizing Categorical Data
Problem 42PFA

Related questions

Question
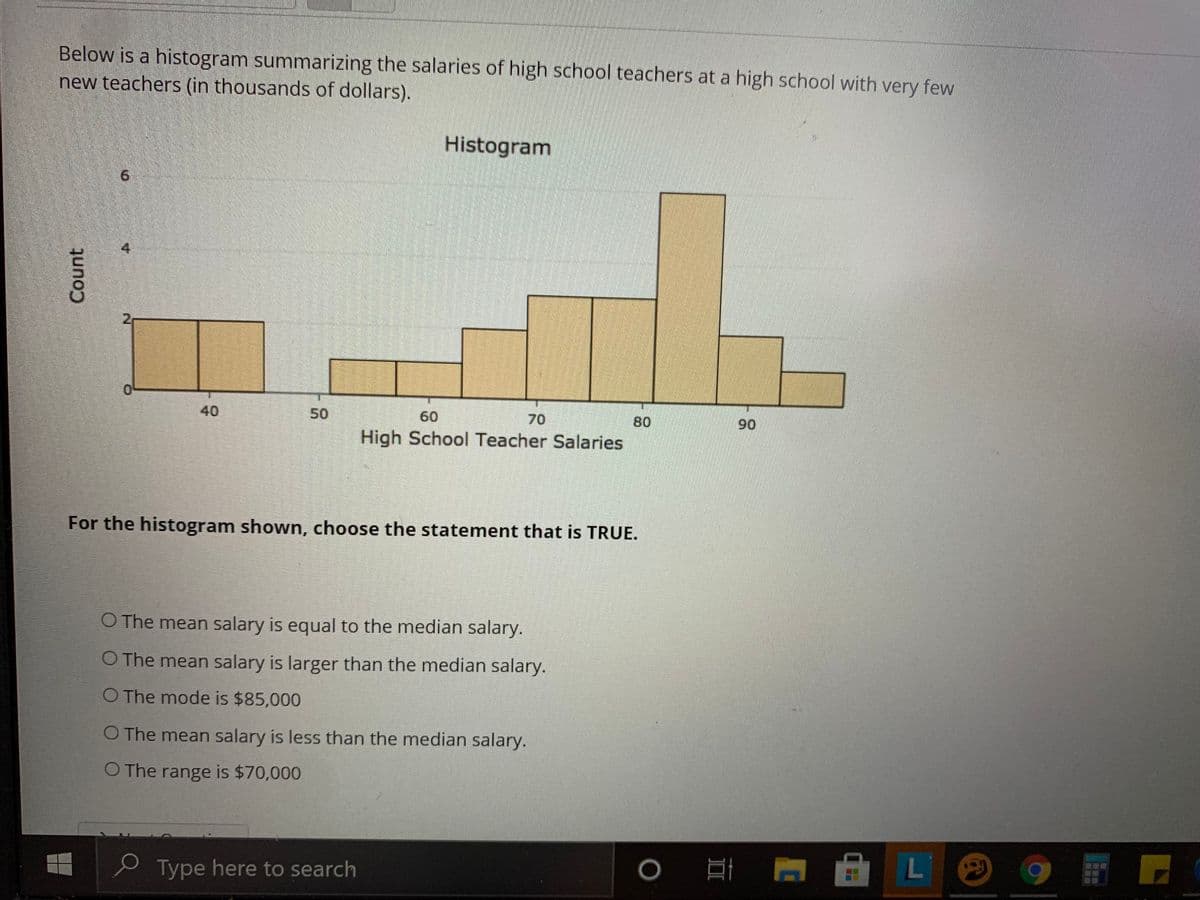
Transcribed Image Text:Below is a histogram summarizing the salaries of high school teachers at a high school with very few
new teachers (in thousands of dollars).
Histogram
9.
4
21
0.
50
60
70
80
High School Teacher Salaries
90
For the histogram shown, choose the statement that is TRUE.
O The mean salary is equal to the median salary.
O The mean salary is larger than the median salary.
O The mode is $85,000
O The mean salary is less than the median salary.
O The range is $70,000
e Type here to search
L
Count
40
Expert Solution
This question has been solved!
Explore an expertly crafted, step-by-step solution for a thorough understanding of key concepts.

This is a popular solution!

Trending now
This is a popular solution!

Step by step
Solved in 2 steps

Knowledge Booster


Learn more about
Need a deep-dive on the concept behind this application? Look no further. Learn more about this topic, statistics and related others by exploring similar questions and additional content below.Recommended textbooks for you
Glencoe Algebra 1, Student Edition, 9780079039897…
Algebra
ISBN:
9780079039897
Author:
Carter
Publisher:
McGraw Hill
Glencoe Algebra 1, Student Edition, 9780079039897…
Algebra
ISBN:
9780079039897
Author:
Carter
Publisher:
McGraw Hill