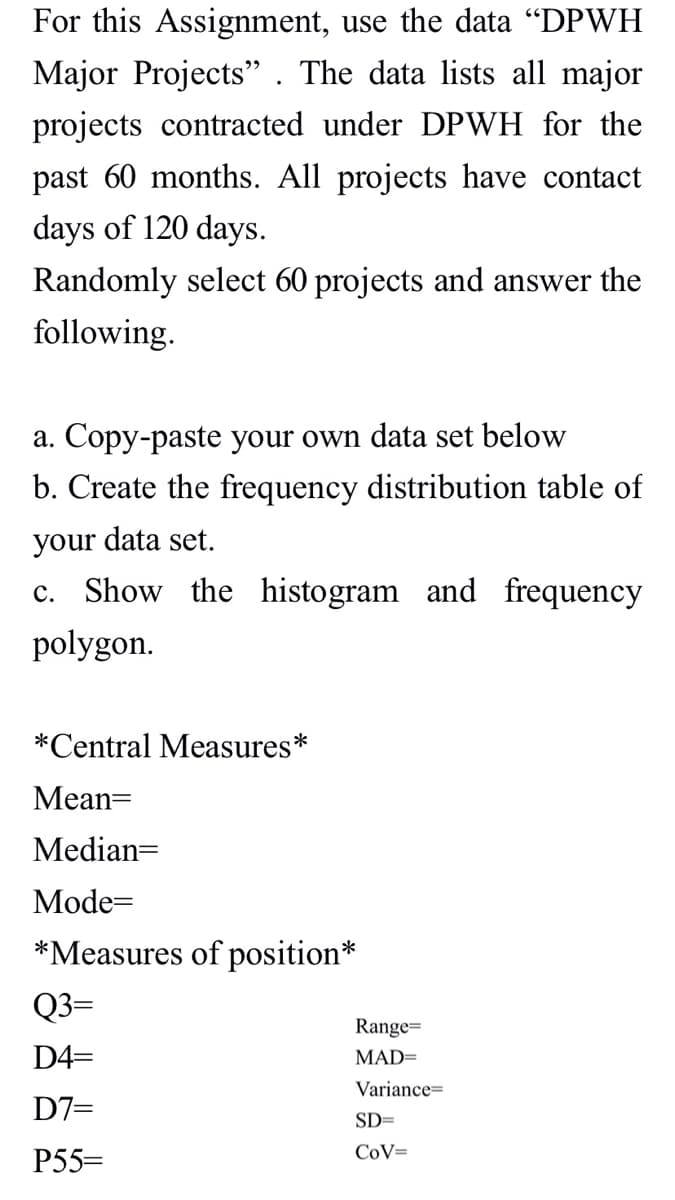
For this Assignment, use the data "DPWH Major Projects". The data lists all major projects contracted under DPWH for the past 60 months. All projects have contact days of 120 days. Randomly select 60 projects and answer the following. a. Copy-paste your own data set below b. Create the frequency distribution table of your data set. c. Show the histogram and frequency polygon. *Central Measures * Mean= Median= Mode= *Measures of position* Q3= D4= D7= P55= Range= MAD= Variance SD= CoV=
For this Assignment, use the data "DPWH Major Projects". The data lists all major projects contracted under DPWH for the past 60 months. All projects have contact days of 120 days. Randomly select 60 projects and answer the following. a. Copy-paste your own data set below b. Create the frequency distribution table of your data set. c. Show the histogram and frequency polygon. *Central Measures * Mean= Median= Mode= *Measures of position* Q3= D4= D7= P55= Range= MAD= Variance SD= CoV=

Glencoe Algebra 1, Student Edition, 9780079039897, 0079039898, 2018
18th Edition
ISBN:9780079039897
Author:Carter
Publisher:Carter
Chapter10: Statistics
Section10.5: Comparing Sets Of Data
Problem 26PFA

Related questions
Question
Please bartleby help me with my assignment
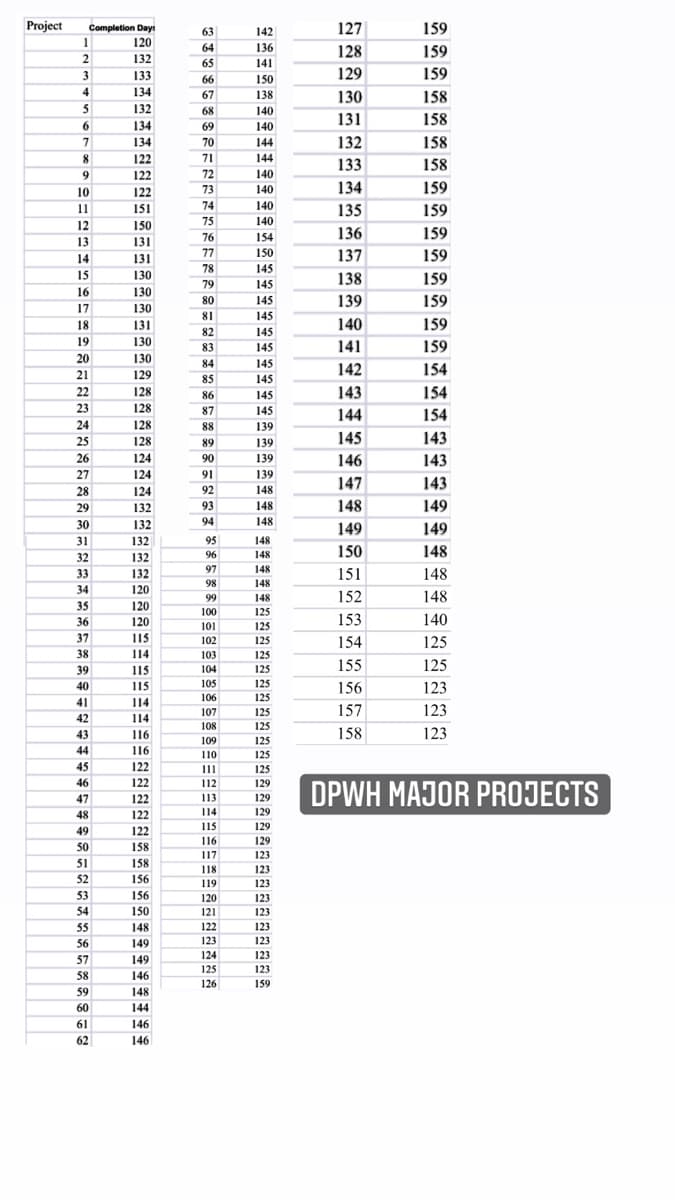
Transcribed Image Text:Project Completion Days
1
120
2
132
3
133
4
134
5
132
6
134
7
134
8
122
9
122
10
122
11
151
12
150
13
131
M
14
131
15
130
16
130
17
130
18
131
19
130
20
130
21
129
22
128
23
128
24
128
25
128
26
124
27
124
28
20
124
29
132
132
29
30
132
132
31
32
33
34
26
35
26
36
37
20
38
39
40
40
7
41
52
42
7
43
7
44
17
45
"
46
47
40
48
10
49
50
50
51
52
20
53
De
54
55
30
56
37
57
58
59
60
61
62
132
122
132
132
120
120
130
120
130
120
116
115
1
114
w
115
116
115
114
w
114
w
116
116
116
133
122
***
122
123
122
133
122
133
122
140
158
158
156
150
156
130
150
100
148
140
149
27
149
149
146
148
144
146
146
63
64
65
66
67
68
69
70
71
24
72
73
74
75
76
77
78
79
80
81
82
83
84
85
86
87
88
89
90
91
92
93
94
95
96
97
98
99
100
101
102
103
104
105
106
107
108
109
110
111
112
113
114
115
116
117
118
119
120
121
122
123
124
125
126
142
136
141
150
138
156
140
140
140
www
144
144
140
240
140
www
140
www
140
154
150
***
145
20
140
145
145
145
*
AKO
145
20
145
20
145
145
20
145
**
145
130
139
130
139
120
139
139
148
148
148
148
148
148
148
148
125
125
125
125
125
125
125
125
125
125
125
125
129
129
129
129
129
123
123
123
123
123
123
123
123
123
159
127
159
128
159
129
159
130
158
131
158
132
158
133
158
134
159
135
159
136
159
137
159
138
159
139
159
140
159
141
159
142
154
143
154
144
154
145
143
146
143
147
143
148
149
149
149
150
148
151
148
152
148
153
140
154
125
155
125
156
123
157
123
158
123
DPWH MAJOR PROJECTS
Transcribed Image Text:For this Assignment, use the data "DPWH
Major Projects". The data lists all major
projects contracted under DPWH for the
past 60 months. All projects have contact
days of 120 days.
Randomly select 60 projects and answer the
following.
a. Copy-paste your own data set below
b. Create the frequency distribution table of
your data set.
c. Show the histogram and frequency
polygon.
*Central Measures *
Mean=
Median=
Mode=
*Measures of position*
Q3=
D4=
D7=
P55=
Range=
MAD=
Variance
SD=
CoV=
Expert Solution
This question has been solved!
Explore an expertly crafted, step-by-step solution for a thorough understanding of key concepts.

Step by step
Solved in 4 steps with 2 images

Recommended textbooks for you
Glencoe Algebra 1, Student Edition, 9780079039897…
Algebra
ISBN:
9780079039897
Author:
Carter
Publisher:
McGraw Hill

Holt Mcdougal Larson Pre-algebra: Student Edition…
Algebra
ISBN:
9780547587776
Author:
HOLT MCDOUGAL
Publisher:
HOLT MCDOUGAL
Glencoe Algebra 1, Student Edition, 9780079039897…
Algebra
ISBN:
9780079039897
Author:
Carter
Publisher:
McGraw Hill
Holt Mcdougal Larson Pre-algebra: Student Edition…
Algebra
ISBN:
9780547587776
Author:
HOLT MCDOUGAL
Publisher:
HOLT MCDOUGAL