Frequency 25 28 20 27 15 10 14 1 10 12 Siblings a) What type of graph is this? b) How would you best describe the distribution of the data: skewed right, skewed left, or normal? c) Approximately how many students have between 2 to 4 siblings? d) What percent of students had less than 2 siblings or more than 8 siblings. e) What percent of students had between 6 to 8 siblings? Round to 1 decimal place. f) Suppose the mean number of siblings was about 6.5. Do you expect the median to be above or below 6.5? Explain. g) Which do you think is a better estimator in terms of measure center: mean or median? h) In terms of the measure of variation, what would be a better estimator: range, standard deviation, or interquartile range. 2. 5.
Frequency 25 28 20 27 15 10 14 1 10 12 Siblings a) What type of graph is this? b) How would you best describe the distribution of the data: skewed right, skewed left, or normal? c) Approximately how many students have between 2 to 4 siblings? d) What percent of students had less than 2 siblings or more than 8 siblings. e) What percent of students had between 6 to 8 siblings? Round to 1 decimal place. f) Suppose the mean number of siblings was about 6.5. Do you expect the median to be above or below 6.5? Explain. g) Which do you think is a better estimator in terms of measure center: mean or median? h) In terms of the measure of variation, what would be a better estimator: range, standard deviation, or interquartile range. 2. 5.

Glencoe Algebra 1, Student Edition, 9780079039897, 0079039898, 2018
18th Edition
ISBN:9780079039897
Author:Carter
Publisher:Carter
Chapter10: Statistics
Section10.4: Distributions Of Data
Problem 20PFA

Related questions
Question
Transcribed Image Text:Frequency
25
28
20
27
15
10
14
1
10
12
Siblings
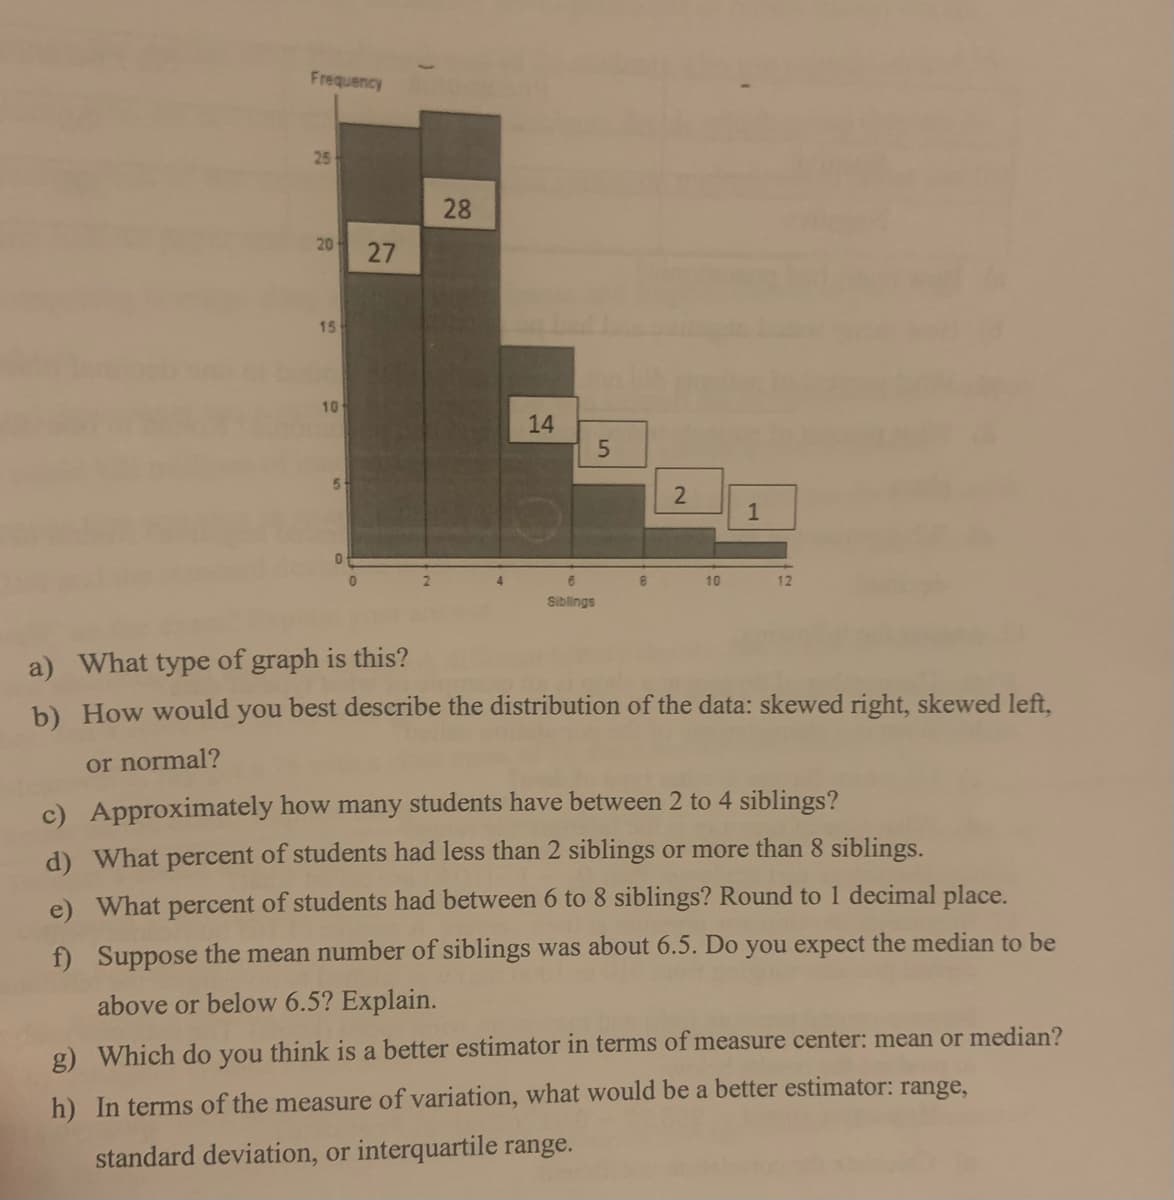
a) What type of graph is this?
b) How would you best describe the distribution of the data: skewed right, skewed left,
or normal?
c) Approximately how many students have between 2 to 4 siblings?
d) What percent of students had less than 2 siblings or more than 8 siblings.
e) What percent of students had between 6 to 8 siblings? Round to 1 decimal place.
f) Suppose the mean number of siblings was about 6.5. Do you expect the median to be
above or below 6.5? Explain.
g) Which do you think is a better estimator in terms of measure center: mean or median?
h) In terms of the measure of variation, what would be a better estimator: range,
standard deviation, or interquartile range.
2.
Expert Solution
This question has been solved!
Explore an expertly crafted, step-by-step solution for a thorough understanding of key concepts.

Step by step
Solved in 3 steps with 3 images

Recommended textbooks for you
Glencoe Algebra 1, Student Edition, 9780079039897…
Algebra
ISBN:
9780079039897
Author:
Carter
Publisher:
McGraw Hill

Big Ideas Math A Bridge To Success Algebra 1: Stu…
Algebra
ISBN:
9781680331141
Author:
HOUGHTON MIFFLIN HARCOURT
Publisher:
Houghton Mifflin Harcourt
Glencoe Algebra 1, Student Edition, 9780079039897…
Algebra
ISBN:
9780079039897
Author:
Carter
Publisher:
McGraw Hill
Big Ideas Math A Bridge To Success Algebra 1: Stu…
Algebra
ISBN:
9781680331141
Author:
HOUGHTON MIFFLIN HARCOURT
Publisher:
Houghton Mifflin Harcourt