frequency, and n represents the total number of sar ginal list of data values, 11.1. d to one decimal place as needed.)
frequency, and n represents the total number of sar ginal list of data values, 11.1. d to one decimal place as needed.)

Glencoe Algebra 1, Student Edition, 9780079039897, 0079039898, 2018
18th Edition
ISBN:9780079039897
Author:Carter
Publisher:Carter
Chapter10: Statistics
Section10.4: Distributions Of Data
Problem 19PFA

Related questions
Question
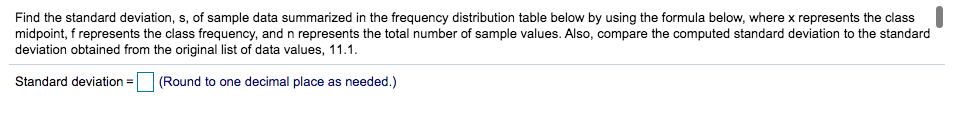
Transcribed Image Text:Find the standard deviation, s, of sample data summarized in the frequency distribution table below by using the formula below, where x represents the class
midpoint, f represents the class frequency, and n represents the total number of sample values. Also, compare the computed standard deviation to the standard
deviation obtained from the original list of data values, 11.1.
Standard deviation =
(Round to one decimal place as needed.)

Transcribed Image Text:Interval
20-29
30-39
40-49
50-59
60-69
70-79
80-89
Frequency
2
1
2
18
36
35
Expert Solution
This question has been solved!
Explore an expertly crafted, step-by-step solution for a thorough understanding of key concepts.

This is a popular solution!

Trending now
This is a popular solution!

Step by step
Solved in 2 steps

Knowledge Booster


Learn more about
Need a deep-dive on the concept behind this application? Look no further. Learn more about this topic, statistics and related others by exploring similar questions and additional content below.Recommended textbooks for you
Glencoe Algebra 1, Student Edition, 9780079039897…
Algebra
ISBN:
9780079039897
Author:
Carter
Publisher:
McGraw Hill
Glencoe Algebra 1, Student Edition, 9780079039897…
Algebra
ISBN:
9780079039897
Author:
Carter
Publisher:
McGraw Hill