from Silva and Tenreyro (2017), plots the total fertility rate against real per capita income for 88 countries in 1960 (circles) and in 2013 (triangles). Figure 3 Fertility-Income Relation in 1960 and 2013 O 1960 2013 Fined line 1960 Fited line 2013 2981 GDP per capita (SS) Seume Aunbors using dasa from the World Development Indicaton database. Nate For a sample of 88 countries, the figure shons the scatterplos and fined line that is, the lowes smoothed relationship or locally weighted snoothing function) berween the sotal fertility rate and log of per capita GDP (in consant 2005 USS) in 1960 and 2013. The sanis in log scale. Describe in words what the figure reveals about the relationship be- tween the level of income per capita and fertility in 2013 across countries and discuss to which extend the empirical relationship observed in 2013 is or is not consistent with the predictions of the Solow growth model with population growth, which takes fertility as exogenously given. In relating the graph to the Solow model with population growth be ex- plicit about the assumption you are making for your argument. Now view the graph through the lens of the poverty trap model with endogenous fertility. Use the figure to argue that it supports (or does not support) the claim that income gains in the developing world be- tween 1960 and 2013 explain the observed decline in fertility over this period. Finally, use the graph to support (or contradict) the hypothesis that the worldwide spreading of population- control programs, such as those associated with the Population Council founded by John D. Rockefeller III, explains the observed decline in fertility between 1960 and 2013. Total knility rate
from Silva and Tenreyro (2017), plots the total fertility rate against real per capita income for 88 countries in 1960 (circles) and in 2013 (triangles). Figure 3 Fertility-Income Relation in 1960 and 2013 O 1960 2013 Fined line 1960 Fited line 2013 2981 GDP per capita (SS) Seume Aunbors using dasa from the World Development Indicaton database. Nate For a sample of 88 countries, the figure shons the scatterplos and fined line that is, the lowes smoothed relationship or locally weighted snoothing function) berween the sotal fertility rate and log of per capita GDP (in consant 2005 USS) in 1960 and 2013. The sanis in log scale. Describe in words what the figure reveals about the relationship be- tween the level of income per capita and fertility in 2013 across countries and discuss to which extend the empirical relationship observed in 2013 is or is not consistent with the predictions of the Solow growth model with population growth, which takes fertility as exogenously given. In relating the graph to the Solow model with population growth be ex- plicit about the assumption you are making for your argument. Now view the graph through the lens of the poverty trap model with endogenous fertility. Use the figure to argue that it supports (or does not support) the claim that income gains in the developing world be- tween 1960 and 2013 explain the observed decline in fertility over this period. Finally, use the graph to support (or contradict) the hypothesis that the worldwide spreading of population- control programs, such as those associated with the Population Council founded by John D. Rockefeller III, explains the observed decline in fertility between 1960 and 2013. Total knility rate

Mathematics For Machine Technology
8th Edition
ISBN:9781337798310
Author:Peterson, John.
Publisher:Peterson, John.
Chapter29: Tolerance, Clearance, And Interference
Section: Chapter Questions
Problem 20A: Mating parts are shown in Figure 29-16. The pins in the top piece fit into the holes in the bottom...

Related questions
Question
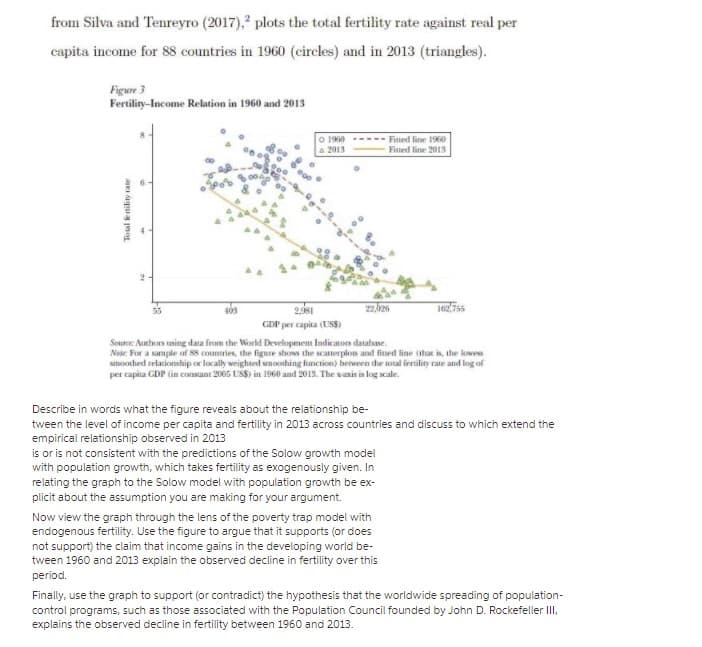
Transcribed Image Text:from Silva and Tenreyro (2017), plots the total fertility rate against real per
capita income for 88 countries in 1960 (circles) and in 2013 (triangles).
Figure 3
Fertility-Income Relation in 1960 and 2013
O 1960
4 2013
Fited line 1960
Fitted line 2013
GDP per capita (USS)
Source: Authors using data from the World Development Indicatorn database.
Note For a sample of 88 countries, the figure shows the scanerplos and fined line (that is, the kowess
smoothed relationship or locally weighted snoothing function) between the total fertility rate and log of
per capita GDP (in constant 2005 USS) in 1960 and 2013. The xaxis is log scale.
Describe in words what the figure reveals about the relationship be-
tween the level of income per capita and fertility in 2013 across countries and discuss to which extend the
empirical relationship observed in 2013
is or is not consistent with the predictions of the Solow growth model
with population growth, which takes fertility as exogenously given. In
relating the graph to the Solow model with population growth be ex-
plicit about the assumption you are making for your argument.
Now view the graph through the lens of the poverty trap model with
endogenous fertility. Use the figure to argue that it supports (or does
not support) the claim that income gains in the developing world be-
tween 1960 and 2013 explain the observed decline in fertility over this
period.
Finally, use the graph to support (or contradict) the hypothesis that the worldwide spreading of population-
control programs, such as those associated with the Population Council founded by John D. Rockefeller III,
explains the observed decline in fertility between 1960 and 2013.
Totul enility rate
Expert Solution
This question has been solved!
Explore an expertly crafted, step-by-step solution for a thorough understanding of key concepts.

Step by step
Solved in 2 steps

Recommended textbooks for you
Mathematics For Machine Technology
Advanced Math
ISBN:
9781337798310
Author:
Peterson, John.
Publisher:
Cengage Learning,

Elementary Geometry For College Students, 7e
Geometry
ISBN:
9781337614085
Author:
Alexander, Daniel C.; Koeberlein, Geralyn M.
Publisher:
Cengage,

Holt Mcdougal Larson Pre-algebra: Student Edition…
Algebra
ISBN:
9780547587776
Author:
HOLT MCDOUGAL
Publisher:
HOLT MCDOUGAL
Mathematics For Machine Technology
Advanced Math
ISBN:
9781337798310
Author:
Peterson, John.
Publisher:
Cengage Learning,
Elementary Geometry For College Students, 7e
Geometry
ISBN:
9781337614085
Author:
Alexander, Daniel C.; Koeberlein, Geralyn M.
Publisher:
Cengage,
Holt Mcdougal Larson Pre-algebra: Student Edition…
Algebra
ISBN:
9780547587776
Author:
HOLT MCDOUGAL
Publisher:
HOLT MCDOUGAL

Elementary Geometry for College Students
Geometry
ISBN:
9781285195698
Author:
Daniel C. Alexander, Geralyn M. Koeberlein
Publisher:
Cengage Learning

Glencoe Algebra 1, Student Edition, 9780079039897…
Algebra
ISBN:
9780079039897
Author:
Carter
Publisher:
McGraw Hill