from sprinkler to drip (C to D and E to F). Assume a f are two pairs of almond production cost curves showing technological change in Irrigation market price of $60/unit. For each set of curves, label the curves and fill in the tables that indicates the profit-maximizing level of output (Q), the marginal cost (MC), the average total cost (ATC), the total revenue (TR), the total cost (TC), the total profit (x), and, the average profit (A) for each pair of costs curves. Make sure to draw the appropriate lines in the graphs and show your calculations (show your work) below the table. Cost Curves C & D 105 100 9
from sprinkler to drip (C to D and E to F). Assume a f are two pairs of almond production cost curves showing technological change in Irrigation market price of $60/unit. For each set of curves, label the curves and fill in the tables that indicates the profit-maximizing level of output (Q), the marginal cost (MC), the average total cost (ATC), the total revenue (TR), the total cost (TC), the total profit (x), and, the average profit (A) for each pair of costs curves. Make sure to draw the appropriate lines in the graphs and show your calculations (show your work) below the table. Cost Curves C & D 105 100 9

Managerial Economics: A Problem Solving Approach
5th Edition
ISBN:9781337106665
Author:Luke M. Froeb, Brian T. McCann, Michael R. Ward, Mike Shor
Publisher:Luke M. Froeb, Brian T. McCann, Michael R. Ward, Mike Shor
Chapter3: Benefits, Costs, And Decisions
Section: Chapter Questions
Problem 9MC

Related questions
Question
Please follow bullet points and answer and SHOW WORK ON GRAPH, label
thank you
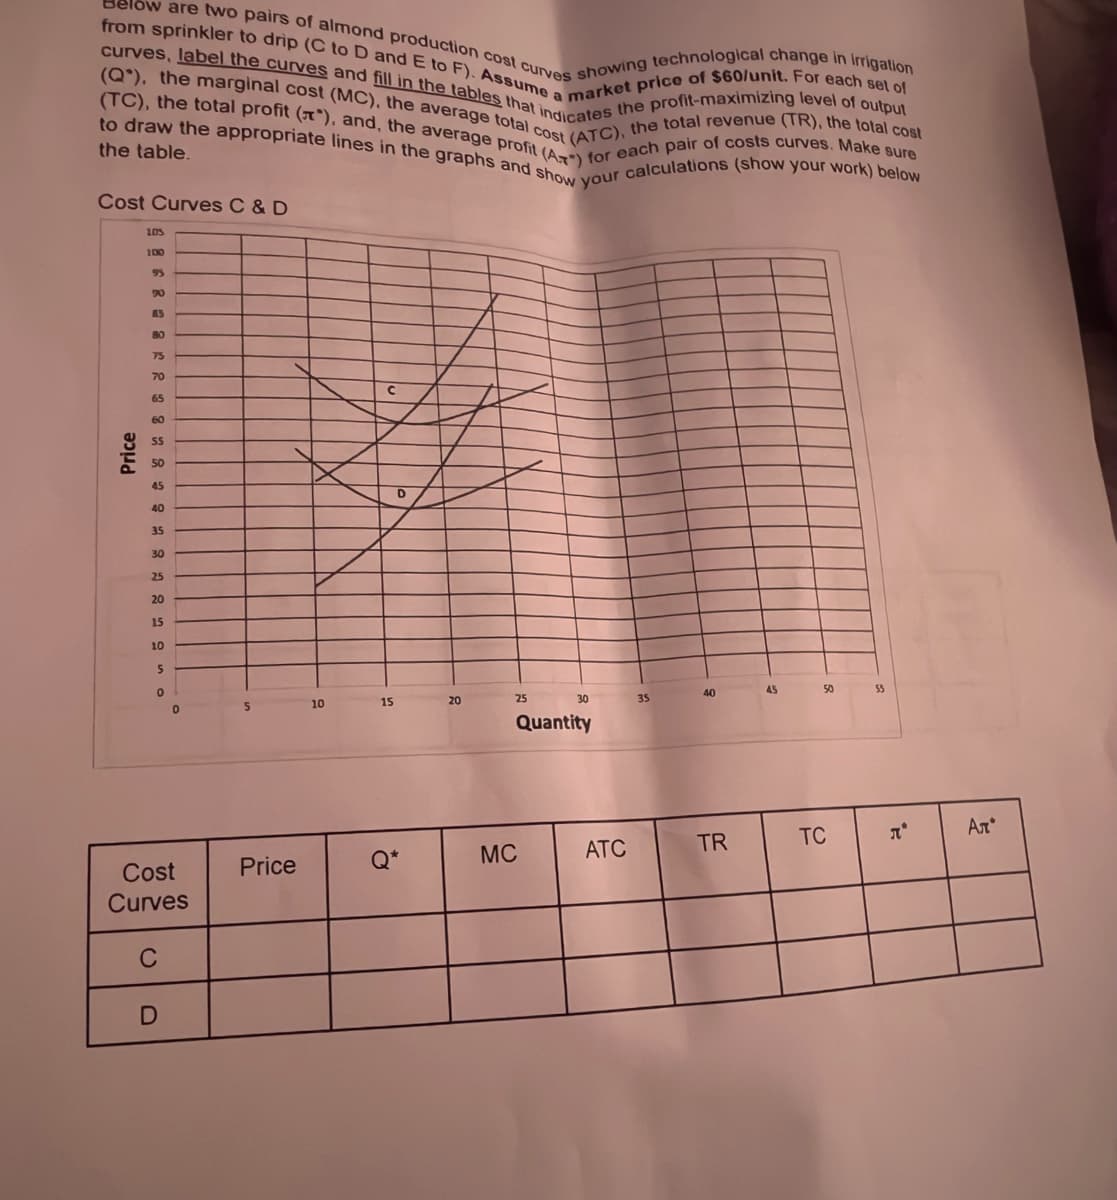
Transcribed Image Text:from sprinkler to drip (C to D and E to F). Assume a market price of $60/unit. For each set of
Below are two pairs of almond production cost curves showing technological change in Irrigation
curves, label the curves and fill in the tables that indicates the profit-maximizing level of output
(Q), the marginal cost (MC), the average total cost (ATC), the total revenue (TR), the total cost
to draw the appropriate lines in the graphs and show your calculations (show your work) below
(TC), the total profit (x), and, the average profit (AT) for each pair of costs curves. Make sure
the table.
Cost Curves C & D
Price
105
100
95
20
AS
80
75
70
65
60
SS
50
45
40
3.5
30
25
20
15
10
5
0
0
Cost
Curves
C
D
5
Price
10
15
D
20
25
30
Quantity
MC
ATC
35
40
TR
45
50
TC
55
2
Ал
Expert Solution
This question has been solved!
Explore an expertly crafted, step-by-step solution for a thorough understanding of key concepts.

Step by step
Solved in 2 steps with 1 images

Knowledge Booster


Learn more about
Need a deep-dive on the concept behind this application? Look no further. Learn more about this topic, economics and related others by exploring similar questions and additional content below.Recommended textbooks for you
Managerial Economics: A Problem Solving Approach
Economics
ISBN:
9781337106665
Author:
Luke M. Froeb, Brian T. McCann, Michael R. Ward, Mike Shor
Publisher:
Cengage Learning

Economics: Private and Public Choice (MindTap Cou…
Economics
ISBN:
9781305506725
Author:
James D. Gwartney, Richard L. Stroup, Russell S. Sobel, David A. Macpherson
Publisher:
Cengage Learning

Microeconomics: Private and Public Choice (MindTa…
Economics
ISBN:
9781305506893
Author:
James D. Gwartney, Richard L. Stroup, Russell S. Sobel, David A. Macpherson
Publisher:
Cengage Learning
Managerial Economics: A Problem Solving Approach
Economics
ISBN:
9781337106665
Author:
Luke M. Froeb, Brian T. McCann, Michael R. Ward, Mike Shor
Publisher:
Cengage Learning
Economics: Private and Public Choice (MindTap Cou…
Economics
ISBN:
9781305506725
Author:
James D. Gwartney, Richard L. Stroup, Russell S. Sobel, David A. Macpherson
Publisher:
Cengage Learning
Microeconomics: Private and Public Choice (MindTa…
Economics
ISBN:
9781305506893
Author:
James D. Gwartney, Richard L. Stroup, Russell S. Sobel, David A. Macpherson
Publisher:
Cengage Learning

Economics (MindTap Course List)
Economics
ISBN:
9781337617383
Author:
Roger A. Arnold
Publisher:
Cengage Learning
