From the ANOVA results, test the hypothesis of equal means and show all five parts for the test. Use a=0.05 for the test Ho:? Ha:? F and PValue:? Reject Ho if:? Conclusion:?
From the ANOVA results, test the hypothesis of equal means and show all five parts for the test. Use a=0.05 for the test Ho:? Ha:? F and PValue:? Reject Ho if:? Conclusion:?

MATLAB: An Introduction with Applications
6th Edition
ISBN:9781119256830
Author:Amos Gilat
Publisher:Amos Gilat
Chapter1: Starting With Matlab
Section: Chapter Questions
Problem 1P

Related questions
Question
From the ANOVA results, test the hypothesis of equal means and show all five parts for the test. Use a=0.05 for the test
Ho:?
Ha:?
F and PValue:?
Reject Ho if:?
Conclusion:?
Transcribed Image Text:In statistics- Search
ms/d/e/1FAlpQLScDTIY2itkJ506wb9PyOpoH3LrLYE04vQbnulEjLfQ0cmkt9Q/formResponse
Problem Solving
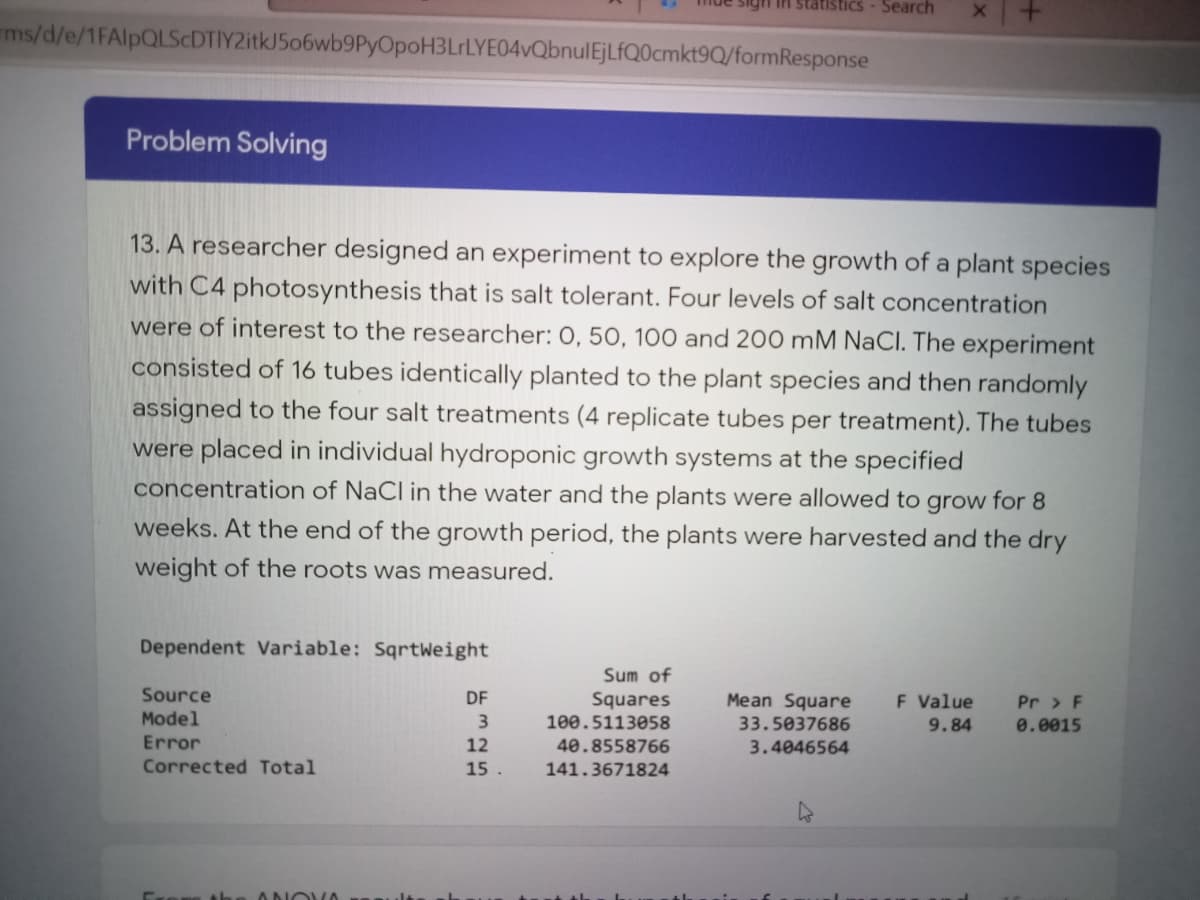
13. A researcher designed an experiment to explore the growth of a plant species
with C4 photosynthesis that is salt tolerant. Four levels of salt concentration
were of interest to the researcher: 0, 50, 100 and 200 mM NaCl. The experiment
consisted of 16 tubes identically planted to the plant species and then randomly
assigned to the four salt treatments (4 replicate tubes per treatment). The tubes
were placed in individual hydroponic growth systems at the spe
ied
concentration of NaCl in the water and the plants were allowed to grow for 8
weeks. At the end of the growth period, the plants were harvested and the dry
weight of the roots was measured.
Dependent Variable: Sqrtweight
Sum of
Source
DF
F Value
Squares
100.5113058
Mean Square
Pr > F
Model
33.5037686
9.84
0.0015
Error
12
40.8558766
3.4046564
Corrected Total
15 .
141.3671824
Erom the ONOVA
Expert Solution
This question has been solved!
Explore an expertly crafted, step-by-step solution for a thorough understanding of key concepts.

Step by step
Solved in 2 steps with 1 images

Recommended textbooks for you
MATLAB: An Introduction with Applications
Statistics
ISBN:
9781119256830
Author:
Amos Gilat
Publisher:
John Wiley & Sons Inc

Probability and Statistics for Engineering and th…
Statistics
ISBN:
9781305251809
Author:
Jay L. Devore
Publisher:
Cengage Learning

Statistics for The Behavioral Sciences (MindTap C…
Statistics
ISBN:
9781305504912
Author:
Frederick J Gravetter, Larry B. Wallnau
Publisher:
Cengage Learning
MATLAB: An Introduction with Applications
Statistics
ISBN:
9781119256830
Author:
Amos Gilat
Publisher:
John Wiley & Sons Inc
Probability and Statistics for Engineering and th…
Statistics
ISBN:
9781305251809
Author:
Jay L. Devore
Publisher:
Cengage Learning
Statistics for The Behavioral Sciences (MindTap C…
Statistics
ISBN:
9781305504912
Author:
Frederick J Gravetter, Larry B. Wallnau
Publisher:
Cengage Learning

Elementary Statistics: Picturing the World (7th E…
Statistics
ISBN:
9780134683416
Author:
Ron Larson, Betsy Farber
Publisher:
PEARSON

The Basic Practice of Statistics
Statistics
ISBN:
9781319042578
Author:
David S. Moore, William I. Notz, Michael A. Fligner
Publisher:
W. H. Freeman

Introduction to the Practice of Statistics
Statistics
ISBN:
9781319013387
Author:
David S. Moore, George P. McCabe, Bruce A. Craig
Publisher:
W. H. Freeman