The mayor of a town has proposed a plan for the annexation of an adjoining community. A political study took a sample of 1000 voters in the town and found that 46% of the residents favored annexation. Using the data, a political strategist wants to test the claim that the percentage of residents who favor annexation is less than 50 %. Testing at the 0.02 level, is there enough evidence to support the strategist's claim? Step 1 of 7: State the null and alternative hypotheses. nswer 画 Tables E Keypad Keyboard Shortcuts Ho: p=0 Ha: p
The mayor of a town has proposed a plan for the annexation of an adjoining community. A political study took a sample of 1000 voters in the town and found that 46% of the residents favored annexation. Using the data, a political strategist wants to test the claim that the percentage of residents who favor annexation is less than 50 %. Testing at the 0.02 level, is there enough evidence to support the strategist's claim? Step 1 of 7: State the null and alternative hypotheses. nswer 画 Tables E Keypad Keyboard Shortcuts Ho: p=0 Ha: p

Holt Mcdougal Larson Pre-algebra: Student Edition 2012
1st Edition
ISBN:9780547587776
Author:HOLT MCDOUGAL
Publisher:HOLT MCDOUGAL
Chapter11: Data Analysis And Probability
Section: Chapter Questions
Problem 8CR

Related questions

Topic Video
Question
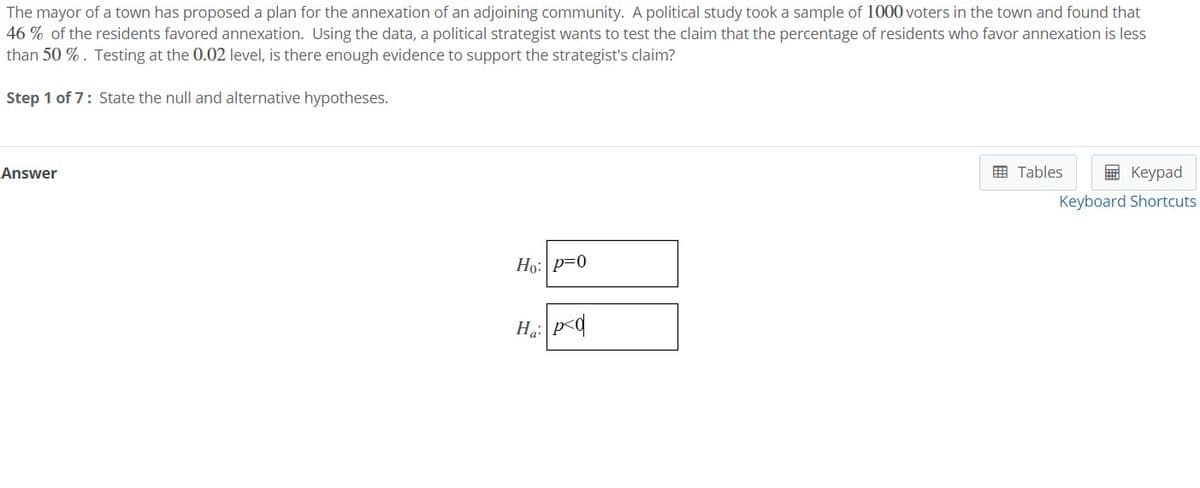
Transcribed Image Text:The mayor of a town has proposed a plan for the annexation of an adjoining community. A political study took a sample of 1000 voters in the town and found that
46 % of the residents favored annexation. Using the data, a political strategist wants to test the claim that the percentage of residents who favor annexation is less
than 50 %. Testing at the 0.02 level, is there enough evidence to support the strategist's claim?
Step 1 of 7: State the null and alternative hypotheses.
Answer
囲 Tables
E Keypad
Keyboard Shortcuts
Ho: p=0
Ha: p<q
Expert Solution
This question has been solved!
Explore an expertly crafted, step-by-step solution for a thorough understanding of key concepts.

This is a popular solution!

Trending now
This is a popular solution!

Step by step
Solved in 2 steps with 1 images

Knowledge Booster


Learn more about
Need a deep-dive on the concept behind this application? Look no further. Learn more about this topic, statistics and related others by exploring similar questions and additional content below.Recommended textbooks for you
Holt Mcdougal Larson Pre-algebra: Student Edition…
Algebra
ISBN:
9780547587776
Author:
HOLT MCDOUGAL
Publisher:
HOLT MCDOUGAL
Holt Mcdougal Larson Pre-algebra: Student Edition…
Algebra
ISBN:
9780547587776
Author:
HOLT MCDOUGAL
Publisher:
HOLT MCDOUGAL