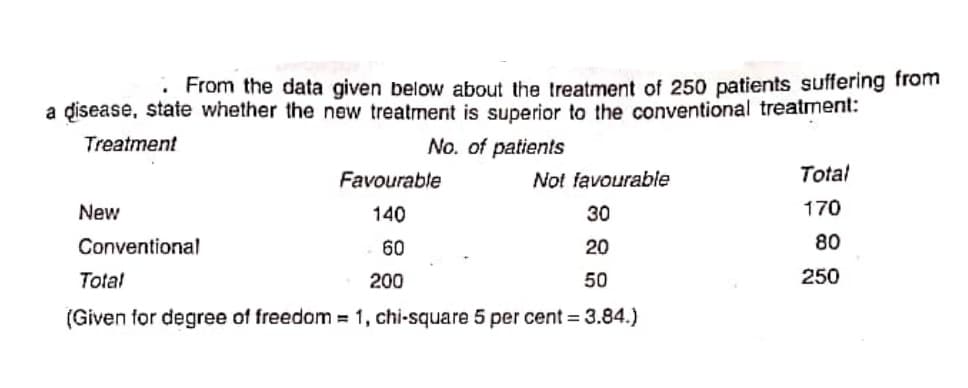
• From the data given below about the treatment of 250 patients suffering f a disease, state whether the new treatment is superior to the conventional treatment: Treatment No. of patients Favourable Not favourable Total New 140 30 170 Conventional 60 20 80 Total 200 50 250 (Given for degree of freedom = 1, chi-square 5 per cent = 3.84.) %3D %3D


Q: For the past decade, rubber powder has been used in asphalt cement to improve performance. An articl...
A: For the given data set Find ( b ) Coefficient of determination = ? ( c ) estimate of the error stand...
Q: (a) x 0 1 2 P(x) 0.23 0.63 0.14 a-Yes. The probabilities sum to 1. b-No. The probabilities sum ...
A:
Q: It is a descriptive measure of the population. A parameter B ) discrete random variable C statistic ...
A: Given : A descriptive measure of the population
Q: (b) Calculate the equation of the estimated regression line. (Round all numerical values to two deci...
A:
Q: llustration 10. Obtain the value of median from the following data: 753, 91, 384, 591, 522, . 777, 2...
A:
Q: For items 1-2, consider the following: The members of Math Club are to choose a representative among...
A: Given Information: Number of votes 18 12 5 3 2 2 First choice H T M A H T Second choice M A T...
Q: Suppose, in a car shop, the number of cars sold by a salesman follows a probability distribution wit...
A: Given Suppose, in a car shop, the number of cars sold by a salesman follows a probability distributi...
Q: Account name b. Months in the calendar c. Average monthly savings d. Number of bank accounts e. None...
A: 1) Interval scale is a type of measurement scale where the order of the values and the difference be...
Q: The number of named Atlantic storms for 9 consecutive years is: 7, 8, 14, 11, 12, 7, 6, 11, 13., We ...
A: As per our guidelines we can solve first three sub part of question and rest can be reposted. Soluti...
Q: (u) The mean marks of 100 students were found to be 40. Later on it was discovered that a score of 5...
A:
Q: In a certain inspection site, it is known that, on the average, 1 in every 50 persons exceeded 37 C ...
A: Since the probability of the first person with an exceeding temperature of 37C (i.e., the first succ...
Q: Standardized tests: In a particular year, the mean score on the ACT test was 22.3 and the standard d...
A:
Q: Explain, giving reasons, which is more important, applied or basic research
A: Applied Research (AR) and Basic Research (BR) are techniques of research.
Q: Evaluate the following F(5;4) (the incomplete gamma
A: F(5; 4): Formula: Fx;α=∫0x1γαyα-1e-ydy Consider, F5;4=∫051γ4y4-1e-ydy =16∫05y3e-ydy ...
Q: 1. A team of scientists wants to test a new medication to see if it has either a positive or negativ...
A: Hi! Thank you for the question, As per the honor code, we are allowed to answer three sub-parts at a...
Q: Illustration 5. Classify the following data by taking class interval such that their mid values are ...
A:
Q: Express the confidence interval 0.175 + 0.064 in open interval form (i.e., (0.155,0.855), Question H...
A:
Q: In an experiment on immunization of cattle from tuberculosis, the following résults were obtained : ...
A:
Q: A group of BSMLS sophomores wanted to determine if the amount of milktea a person consumes can lead ...
A: (4): Null hypothesis in words H0: There is no association between milktea and kilos Gain. (5): alte...
Q: Lunch break: In a recent survey of 660 working Americans ages 25-34, the average weekly amount spent...
A: Given : Let X be a r.v Mean (μ) = 43.79 Standard deviation (σ) = 3.08
Q: Let X denote the reaction time, in seconds, to a certain stimulus and Y denote the temperature (•F) ...
A: Here X: Reaction time in second Y: Temperature Given joint pdf of x and y is f(x,y)= 4xy , ...
Q: If we are testing for the difference between the means of 2 related populations with samples of n1=2...
A: Given,samples size is n= n1=20 and n2=20
Q: What is the value of the standardized test statistic? What is the P-value of the test statistic? ...
A: It is given that Sample size n = 13 Sample mean = 28.5 Sample SD = 4.5 Level of significance = 0.05
Q: Find the value of z such that the area under the standard normal curve to the left of z is 0.9251. ...
A:
Q: Illustration 3. Find out the value of quartile deviation and its coefficient from the following data...
A: Given: Roll number Marks 1 20 2 28 3 40 4 12 5 30 6 15 7 50
Q: From the following data of the marks obtainced by 60 students of a class, calculate the arıthmetic m...
A:
Q: Researchers conducted a study of smartphone use among adults. A cell phone company claimed that iPho...
A: . Find a 95% confidence interval for the difference in proportions between white and African America...
Q: Illustration 3. Find out the value of quartile deviation and its coefficient from the following data...
A: Given data is Roll No. 1 2 3 4 5 6 7 Marks 20 28 40 12 30 15 50
Q: Based on a poll, among adults who regret getting tattoos, 15% say that they were too young when they...
A: Givenp=0.15n=4Let "x" be the adults that say they were too young to get tattoos x~Binomial(n=4,p=0.1...
Q: 19. Which of the following are the possible values of a random variable “Y: Scores of a student in a...
A: 19. Here Y is scores of a student in a 5 item test so it takes values 0, 1, 2, 3, 4, 5 Hence, Y = { ...
Q: A consumer group claims that the mean minimum time it takes for a sedan to travel a quarter mile is ...
A: Given that x̄ = 15.5 μ = 14.8 s = 2.09 n = 22 Note: According to bartleby experts question answers ...
Q: If the standard deviation, o is known the 2-distribution values may not be used to determine interva...
A:
Q: 4. Variables M and N are O A. both qualitative R-keth
A: Solution: The variables can be classified into two types. 1) Qualitative variable and 2) Quantitat...
Q: The results obtained from statistics analysis between the pulse rate at baseline and the pulse rate ...
A:
Q: In the 2008 GSS, those who said they were raised as religious fundamentalists had a mean educational...
A: There are two independent samples which are fundamentalists and non fundamentalists. We have to test...
Q: Suppose that the amount of time that students spend studying in the library in one sitting is normal...
A:
Q: Ages Number of students 15-18 2 19-22 4 23-26 8 27-30 9 31-34 6 35-38 3 Based on the frequency dis...
A: Given data is Age No. of students 15-18 2 19-22 4 23-26 8 27-30 9 31-34 6 35-38 3 ...
Q: Interpret the time plot. What are the components you can observe in the time series plot? Is the da...
A: Given The time-series plot is as follows:
Q: Elasticity of Demand for Tires The management of Titan Tire company has determined that the quantity...
A:
Q: The average time to run the 5K fun run is 24 minutes and the standard deviation is 2.6 minutes. 8 ru...
A: As per guidelines expert have to answer first question three subparts only dear student please uploa...
Q: The event of holding your breath for 30 minutes is __________. A.a sure event B.an equally likely ev...
A: Impossible event An event is said to be an impossible event when the probability of occurrence of th...
Q: butterflies (Damaus plexippus), a species that undertakes large seasonal migrations size. Why might ...
A: We have given that Sample size n =92 Sample mean =11.7957 Standard deviation =1.1759
Q: or the following scenarios provide the following: the null and alternativehypotheses explain whethe...
A: Comment: As per the our company guidelines we are supposed to answer only three subparts. Kindly rep...
Q: Length of staying (in minutes) Number of customers (f) 20 - 26 2 27 - 33 4 34 - 40 13 41 - 47 10 48-...
A:
Q: An epidemiologist is worried about the prevalence of the flu in East Vancouver and the potential sho...
A: Given data isn=332x=36p^=xn=36332=0.108434Margin og error(E)=0.04Confidence level=95%
Q: A die is rolled 360 times. Find the mean, variance, and standard deviation of the number of 4s that ...
A:
Q: Use the given confidence interval limits to find the point estimate p and the margin of error E. 0.0...
A:
Q: Here is the Minitab result for the mean ideal BMI for women (top) and men (bottom):5 One-sample T N...
A: We have given that N=40 Mean=18.850 Stdev= 1.750
Q: Leila owns a pizza shop. She determines the number of pizza boxes that are sold per day. Probability...
A: Given: Number of boxes (X) Probability P(X) 35 0.1 36 0.2 37 0.3 38 0.3 39 0.1
Q: Using your own words, discuss how a correlated-groups t test has more statistical power in compariso...
A:


Trending now
This is a popular solution!

Step by step
Solved in 2 steps

- The defective percentage of bricks produced by a certain process is 20%. A new method isintroduced which is supposed to reduce the defective percentage. 150 bricks produced by thismethod showed 27 of them are defective. Does this data support the above claim at significancelevela = 0.01?Data from a recent year showed that 55% of the tens of thousands of applicants to a certain program were accepted. A company that trains applicants claimed that 135 of the 240 students, it trained that year were accepted. Assume these trainees were representative of the population of applicants. Has the company demonstrated a real improvement over the average? What is the P-value?A study was conducted that measured the total brain volume (TBV) (in ) of patients that had schizophrenia and patients that are considered normal. Table #9.3.5 contains the TBV of the normal patients and table #9.3.6 contains the TBV of schizophrenia patients ("SOCR data oct2009," 2013). Is there enough evidence to show that the patients with schizophrenia have less TBV on average than a patient that is considered normal? Test at the 10% level. (Show work) Table #9.3.5: Total Brain Volume (in ) of Normal Patients 1663407 1583940 1299470 1535137 1431890 1578698 1453510 1650348 1288971 1366346 1326402 1503005 1474790 1317156 1441045 1463498 1650207 1523045 1441636 1432033 1420416 1480171 1360810 1410213 1574808 1502702 1203344 1319737 1688990 1292641 1512571 1635918 Table #9.3.6: Total Brain Volume (in ) of Schizophrenia Patients 1331777 1487886 1066075 1297327 1499983…
- What is the kurtosis for the distribution of scores with a mean of 9.02 and a mode of 3?In this study, the protection of aquatic ecosystems is an important goal of Ville de Montréal. In particular, Thomas wants to see whether the contamination of creeks (ruisseaux in French) by Escherichia coli differs among the months of May, June, July, and August. Therefore, herandomly samples six creeks in different areas. For each creek, he collects water samples from May to August, and measures the amount of E. coli, expressed in colony-forming units (CFU) per 100 mL of water. For each combination of a month and a creek, he thus obtains an E. coli contamination value, i.e., 24 observations in total. A preliminary statistical analysis produces the following results. Which pairs of months show significant differences in mean E. coli contamination? Explain your reasoning and justify your answer to this question with the results of a statistical procedure. Use α = 0.05.In this study, the protection of aquatic ecosystems is an important goal of Ville de Montréal. In particular, Thomas wants to see whether the contamination of creeks (ruisseaux in French) by Escherichia coli differs among the months of May, June, July, and August. Therefore, herandomly samples six creeks in different areas. For each creek, he collects water samples from May to August, and measures the amount of E. coli, expressed in colony-forming units (CFU) per 100 mL of water. For each combination of a month and a creek, he thus obtains an E. coli contamination value, i.e., 24 observations in total. A preliminary statistical analysis produces the following results. Which pairs of months show significant differences in mean E. coli contamination? Explain your reasoning and justify your answer to this question with the results of a statistical procedure. Use α = 0.05. Data: May= 66, June= 104, July=105, August= 88
- In this study, the protection of aquatic ecosystems is an important goal of Ville de Montréal. In particular, Thomas wants to see whether the contamination of creeks (ruisseaux in French) by Escherichia coli differs among the months of May, June, July, and August. Therefore, herandomly samples six creeks in different areas. For each creek, he collects water samples from May to August, and measures the amount of E. coli, expressed in colony-forming units (CFU) per 100 mL of water. For each combination of a month and a creek, he thus obtains an E. coli contamination value, i.e., 24 observations in total. A preliminary statistical analysis produces the following results. Part A: Does the mean E. coli contamination differ significantly among the four months? Justify your answer to this question with the result of a statistical test. Use α = 0.05. Part B:Which pairs of months show significant differences in mean E. coli contamination? Explain your reasoning and justify your answer to this…An experiment has been conducted to evaluate a new process for producing syntheticdiamonds. A number of diamonds have been generated by the new process with recordedweights of 0.46, 0.61, 0.52, 0.48, 0.57, and 0.54 carat. A study of the process costsindicates that the actual average weight of the diamonds must exceed 0.5 in order that theprocess be operated at a profitable level. a). At 5% level of significance, is there sufficient evidence to conclude that the process isoperating at a profitable level? Your conclusion must be in terms of the P-Value aswell as setting up a Rejection Region. You must show all necessary work. b). Which statistical distribution should be applied in this situation and why? Explaincarefully. c). What type of error is possible and describe this error in terms of the problemAn experiment has been conducted to evaluate a new process for producing syntheticdiamonds. A number of diamonds have been generated by the new process with recordedweights of 0.46, 0.61, 0.52, 0.48, 0.57, and 0.54 carat. A study of the process costsindicates that the actual average weight of the diamonds must exceed 0.5 in order that theprocess be operated at a profitable level.a). At 5% level of significance, is there sufficient evidence to conclude that the process isoperating at a profitable level? Your conclusion must be in terms of the P-Value aswell as setting up a Rejection Region. You must show all necessary work.b). Which statistical distribution should be applied in this situation and why? Explaincarefully.c). What type of error is possible and describe this error in terms of the problem.d). Based on a 95% confidence level, estimate the actual mean weight of syntheticdiamonds using the new process.e). Carefully interpret this interval estimation.f). Explain carefully whether…
- A pharmcuticle company claims that its new drug reduces systolic blood pressure. The systolic blood pressure (in millimeters of Mercury) for 9 patients before taking the new drug and 2 hours after taking the drug are shown in the table below. is there enough evidence support the company's claim? Let D =(blood pressure before taking new drug)- (blood pressure after taking new drug).use significant levels of a=their 0.05 for the test. Assume that the systolic blood pressure levels are normally distributed for the population of patience both Before & After taking the new drug. 1.State the null and alternative hypothesis for the test. 2. Find the value of the standard deviation of the paired differences. Round to one decimal place. 3.compute the value of the test statistic. Round to three decimal places 4.determine the decision rule for rejecting the null hypothesis Ho. Round the numerical portion to three decimals. 5.make decision for the hypothesis test.Assume that anxiety scores as measured by an anxiety assessment inventory arenormally distributed with μ = 20 and σ = 4. A sample of 4 patients who areundergoing treatment for anxiety is randomly selected, and their mean anxiety scoreX = 22. Is the average anxiety score from patients who are under treatmentsignificantly different from 20? Assume a = .10.The average age at which adolescent girls reach their adult height is 16 years. Suppose you have a sample of 29 adolescent girls who are developmentally delayed, and who have an average age at which they reached their adult height of 17.8 years and a sample variance of 77.4 years. You want to test the hypothesis that adolescent girls who are developmentally delayed have a different age at which they reached their adult height than all adolescent girls. In order to calculate the t statistic, you first need to calculate the estimated standard error. The estimated standard error SM= (round to four decimals)
