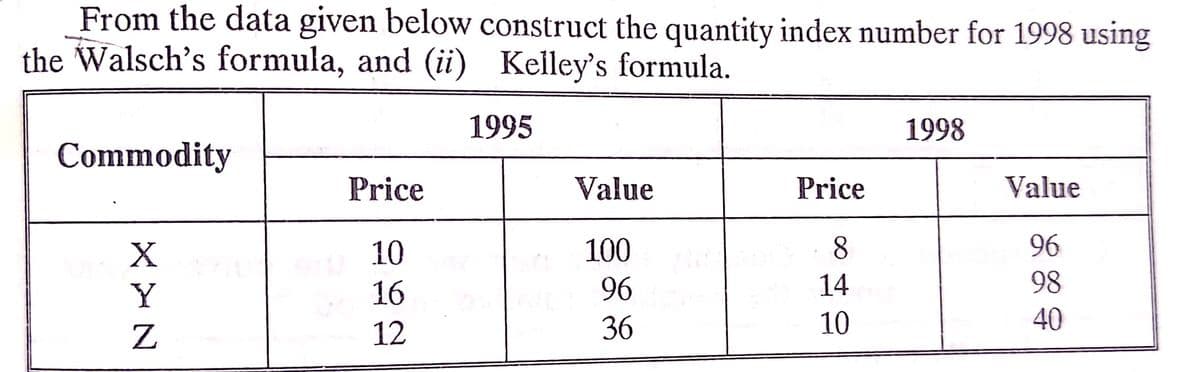
From the data given below construct the quantity index number for 1998 using the Walsch's formula, and (ii) Kelley's formula. 1995 1998 Commodity Price Value Price Value 10 100 8 96 Y 16 96 14 98 Z 12 36 10 40


Q: In how many ways can 8 persons be seated around a table with 8 chairs if two individuals wanted to…
A:
Q: Coal is carried from a mine in West Virginia to a power plant in New York in hopper cars on a long…
A: Given that mu =75 , s.d =0.8
Q: Σ, -134 , η 10, s= 3.1 Σ - 40.5 , η 9, σ2.9 = 585.9, , r? = 15472.37, n = 27 ( Please note s? = %3D…
A: Given∑xi=134 i=110n=10standard deviation(s)=3.1
Q: You are an econometrician working in the Ministry of Finance in Trinidad and Tobago and using a…
A: Please note that as per our guidelines if multiple questions are posted we can answer the first one.…
Q: A regression analysis was performed to determine if there is a relationship between hours of TV…
A: The independent variable is hours of TV watched per day. The dependent variable is number of sit ups…
Q: Coal is carried from a mine in West Virginia to a power plant in New York in hopper cars on a long…
A:
Q: A chemical manufacturer is concerned about the degree of impurity in the raw material shipments…
A:
Q: a)(c) For each of the accompanying scenarios, figure the estimated effect size (and whether it is…
A: Given the estimated effect size (and whether it is approximately small, medium, or large by…
Q: 2.2. Let Y1, Y2, ..., Y, denote independent and identically distributed random variables from a…
A:
Q: You are an econometrician working in the Ministry of Finance in Trinidad and Tobago and using a…
A: Please note that as per our guidelines we can answer the first question if multiple questions are…
Q: The following table represents the survey conducted in a school. Male female Chicken fried steak…
A:
Q: You are an econometrician working in the Ministry of Finance in Trinidad and Tobago and using a…
A: Please note that as per our guidelines I have answered the first two questions, please repost the…
Q: 2.4. Let Y,, Y2, ., Yn denote a random sample from a uniform distribution with a pdf given by fyl®)…
A:
Q: 3. A bank teller serves customers standing in the queue one by one. Suppose that the service time X;…
A: Given that We have to find
Q: From a continuous uniform distribution, X - Unif[a, b], we are given the following set of data: 5,…
A:
Q: 12. An experiment consists of tossing an unfair coin (44% chance of landing on heads) a specified…
A: Here use counting principle and geometric distribution
Q: 4. The average public elementary school has 468 students with a standard deviation of 87. If a…
A: Here use given step by step solution and normal distribution of sample mean
Q: Use the row of numbers shown below to generate 12 random numbers between 01 and 99. 43027 91116…
A: Introduction: It is required to identify the first 12 numbers between 01 and 99, that would…
Q: The University of the East Europe is interested in the overall performance of its students in the…
A:
Q: The average amount of money that people spend at Don Mcalds fast food place is $7.5200 with a…
A:
Q: An economist claims that the population standard deviation of the monthly income of all the families…
A: Given Information: Population standard deviation σ=2500.00 Sample size n=250 Sample mean x¯=3500.00…
Q: QUESTION 3 The margin of error indicates how accurate a point estimate is in estimating a population…
A: Confidence interval is an interval such that the probability of the unknown parameter to be included…
Q: Statistics students in Oxnard College sampled 10 textbooks in the Condor bookstore and recorded the…
A: For the given data Find the linear model and estimate the cost when x =213
Q: 2. A graphite furnace atomic absorption spectrophotometer (AAS) was used to determine the arsenic…
A: Scatter plot is the graphical representation of the relationship between two variables of a…
Q: digits 1, 2, 3. The board of directors of a corporation must select a president, a secretary, and a…
A: For the given data solve the problems
Q: 2. In a study of the life expectancy of 400 people in a certain geographic region, the mean age at…
A: Given that μ= 70 , σ= 5.1 , n= 50 Formula for Z-score Z=(x̄-μ)/(σ/√n)
Q: et X be the random variable 3 Sum 2/5 Pr(X = x) z Pr(X = z) 1/5 1/5 %3D Pr(X = 1) (a) Fill in the…
A: Let X be the random variable having probability mass function is then we will find the mean and…
Q: pos. a. With 95% confidence the proportion of all caterpillars that lived to become a butterfly is…
A:
Q: Weekly demand at a grocery store for a brand of breakfast cereal is normally distributed with a mean…
A: Let X be the random variable from normal distribution with mean (μ) = 800 and standard deviation (σ)…
Q: In a t-distribution, what is the area under the curve that is to the right of t=2.048 and with…
A: Given t=2.048, df=28
Q: Weekly demand at a grocery store for a brand of breakfast cereal is normally distributed with a mean…
A:
Q: From the following data construct Paasche's index number for the year 1998 with the base 1997. Items…
A:
Q: Direction: Provide step-by-step solutions to the given problem below. Write your answers on the…
A: Population - 2,5,6,9,11,13 Consider sample size (n=2) from population We have to calculate mean and…
Q: A hospital is trying to cut down on emergency room wait times. It is interested in the amount of…
A: We have given that the sample mean 1.5 hours and sample standard deviation s is 0.5 hours. The…
Q: Review the following correlation matrix, which resulted from DVAR being regressed on VARA, VARB, and…
A: Regression analysis is often misinterpreted due to ignorance into some crucial issues.
Q: From the following group indices of wholesale prices in India for the 1998 and the group weights…
A:
Q: Suppose you have the following results for a regression: Intercept=1.3. Slope for X=.2. Standard…
A: The objective is to find out the new intercept, slope, and the standard error of the transformed…
Q: Takes data from a sample and makes inferences (i.e., draw conclusions, make predictions, make…
A: Inferential statistics: It is the procedure whereby inferences (draw conclusion, make predictions,…
Q: 3. For two independent events, A and B, P(A)=D0.1 and P(B)-D0.5. Enter your probabilities as…
A:
Q: The Venn diagram below shows the probabilities of GMA (X) and ABS-CBN (Y as the best TV network in…
A: We have given that from the venn diagram arr P(X) = 0.28 + 0.15 = 0.43 , P(Y) = 0.34 + 0.15 = 0.49…
Q: From the following data compute the quantity index number for 1998 musine (i) Paasche's formula (ii)…
A:
Q: Let X and Y be independent v.a with uniform distribution on the interval (0, 20) and (0, 30)…
A:
Q: 6.28 Prenatal vitamins and Autism. Researchers studying the link between prenatal vitamin use and…
A:
Q: ILLUSTRATING THE PROBABILITY OF A UNION OF TWO EVENTS Determine the following probabilities of…
A: Note: According to Bartleby guidelines, we can answer only first question with their three subparts…
Q: Answer 4 5 6 handwritten
A: Hypothesis is an assumption about the nature of a population that needs to be tested.
Q: Determine the sample size required to achieve power = .93, assuming Ho = 12, o = 8, and H: H1 – Ho >…
A:
Q: From the data given below compute Fisher's ideal index for the year 1998 with 1995 as the base year…
A:
Q: Please solve both and show the work for each of them and parts and can you please show the r code.…
A: Here is given that, mean is 436.5 and standard deviation is 11.9. Sample number is 20. We will use…
Q: The binomial distribution has p = 0.6 and n = 15. Find P(X ≥ 8). Use pmf (with the MS Excel).
A:
Q: The table shows the joint and marginal relative frequencies. Pets Cats Dogs Total Вoys 0.14 0.25…
A: Given that Joint Relative Frequency table Cats Dogs Boys 0.14 0.25 Girls 0.18 0.43

Step by step
Solved in 3 steps

- Read measurements on the enlarged fractional rule shown in Figure 30-12.Spacers are manufactured to the mean dimension and tolerance shown in Figure 29-12. An inspector measures 10 spacers and records the following thicknesses: 0.372" 0.376" 0.379" 0.375" 0.370" 0.373" 0.377" 0.378" 0.371" 0.380" Which spacers are defective (above the maximum limit or below the minimum limit)? All dimensions are in inches.he average consumer unit spent $1874 on apparel and services in2006.That same year, 25 consumer units in theNorth-east had the following annual expenditures, in dollars, on apparel and services. 1417, 1595, 2158, 1820, 1411, 2361, 2371, 2330, 1749, 1872, 2826, 2167, 2304, 1998, 2582, 1982, 1903, 2405, 1660, 2150, 2128, 1889, 2251, 2340, 1850 At the 5% significance level, do the data provide sufficient evidence to conclude that the 2006 mean annual expenditure on apparel and services for consumer units in the Northeast differed from the national mean of $1874?
- The below table contains the total number of deaths worldwide as a result of tsunamis for the period of 2000 to 2005. What is the percentage of deaths that occurred after 2003? Year Total Number of Deaths 2000 1736 2001 3548 2002 513 2003 6848 2004 6543 2005 5499 12042/24687 18890/24687 5499/24687 19403/24687The following information is on food items for the years 2010 and 2018. 2010 2018 Item Price Quantity Price Quantity Margarine (pound) $0.81 18 $2.00 27 Shortening (pound) 0.84 2 1.88 9 Milk (1/2 Gallon) 1.44 74 2.89 63 Potato Chips 2.91 26 3.99 32 Compute Paasche’s index for 2018 using 2010 as the base period. (Round your answer to 2 decimal places.)The following table gives the prices of some food items in the base year and current year and the quantities sold in the base year and current year. Commodity 2000 2005 Price (K) Quantity Price (K) Quantity A 15 15 22 12 B 20 5 27 4 C 4 10 7 5 Compute the following price index numbers for 2005 from the above table: Laspeyre’s price index number Paasche’s price index number
- The following stemplot displays the number of forest fires (the stem is in tens of thousands) that occurred each year over the period from 1980 to 2010.6 | 123777797 | 012233344455688 | 035589 | 069How many data values are in this data set?How many fires were in the year with the greatest number of fires from 1980 to 2010?a) Using the country of the United states, collect data on the quarterly (not seasonallyadjusted) consumer price index rate for 2001 – 2020. Data is presented in this table below Frequency: Quarterly observation_date USACPIALLQINMEI 2001-01-01 74.1297037765224 2001-04-01 74.9032066616881 2001-07-01 75.0016524834365 2001-10-01 74.7906971511185 2002-01-01 75.0579072387213 2002-04-01 75.8736011903506 2002-07-01 76.1970660332381 2002-10-01 76.4361487431984 2003-01-01 77.2096516283642 2003-04-01 77.4909254047881 2003-07-01 77.8706450029604 2003-10-01 77.8847086917816 2004-01-01 78.5878931328414 2004-04-01 79.7129882385370 2004-07-01 79.9942620149610 2004-10-01 80.4724274348816 2005-01-01 80.9787202324446 2005-04-01 82.0616242716767 2005-07-01 83.0601461779816 2005-10-01 83.4820568426175 2006-01-01 83.9320948848957 2006-04-01 85.3525274558365 2006-07-01 85.8306928757571 2006-10-01 85.0993810570550 2007-01-01 85.9666887466581…Complete the table below. Books read within the past year Frequency Relative Frequency Cumulative Frequency none 99 1−51−5 0.1343283582089550.134328358208955 6−106−10 1515 11−1511−15 0.2089552238805970.208955223880597 16−2016−20 1010 21−2521−25 1010 Total 11
