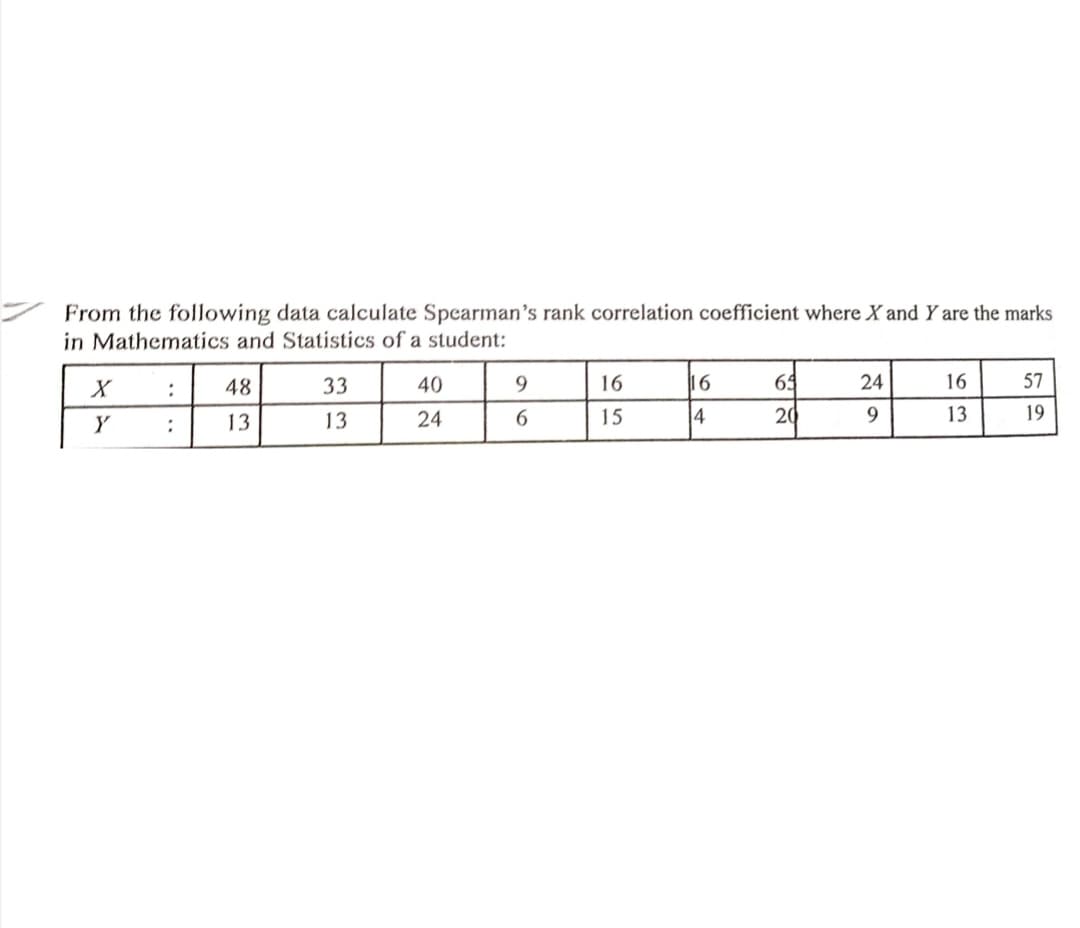
From the following data calculate Spearman's rank correlation coefficient where X and Y are the marks in Mathematics and Statistics of a student: 48 33 40 9. 16 16 65 24 16 57 : 13 13 24 15 4 20 13 19


Q: Probability: One card is drawn from a standard pack of 52. What is the chance that it is either a he...
A: GivenTotal no.of cards = 52No.of heat cards in a deck = 13No.of queen of spade card in a deck =1
Q: Ed's Tires and Brakes has two locations, one on the northwest side of town and one on the southeast ...
A: The conditional probability of happening of event A when event B already happened, can be expressed ...
Q: Give at least one example for each type of frequency distribution. Grouped frequency distribution ...
A: “Since you have posted a question with multiple sub-parts, we will solve first three subparts for yo...
Q: Define the term of Experimental Error ?
A:
Q: Studies of the size and range of wild animal populations often involve tagging observed individual a...
A: Answer:----- Date:----21/2/2022
Q: Find the value of the permutation. 3P1 3P1 =U (Type a whole number.)
A: nPr = n!(n-r)!
Q: Give at least one example (real life example) for each type of frequency distribution. Cumulative ...
A: 1. No. of times a variate value is repeated is called its frequency. CF is the number of observation...
Q: CASE: You want to determine the degree/strength of relationship between height and weight. Variable ...
A:
Q: Refer to the given problem in answering numbers 14-15. The daily demand for copies of a magazine at ...
A: the daily demand for copies of a magazine at a variety store has the probability distribution as fol...
Q: B. Perform Dixon's Q-test and Grubb's test for the following set of data points. Make a conclusion t...
A:
Q: Example I: Using Laplace tranfogm, solve (D² +4D+5)y=5, given that y(0) =0, y"(0) =0.
A:
Q: Ninety-four percent of Washington community college transfers feel that their community college adeq...
A: Solution: Let X be the number that feel that their community college adequately prepared them to han...
Q: 6.96 [Data Set: LO6096] A random sample of n= 6 observations from a normal distribution resulted in ...
A: Given: n=6 95% CI x 8 2 3 7 11 6
Q: 7. Which of the following values can serve as the values of a probability distribution? A. P(1) = 0....
A: Ans#7- Which of the following is a probability distribution
Q: According to the Pak Car Dealers, the mean price for used cars isRs. 900,000. A Firm reviewed a samp...
A: Given Data National mean=900000
Q: A radio shop sells, on an verage, 200 radios per day with a standard deviation of 50 radios After an...
A: Given:
Q: The probability that event A will occur is P(A) = 0.36. What is the probability (in decimal form) th...
A:
Q: Suppose you just purchased a digital music player and have put 15 tracks on it. After listening to t...
A:
Q: If o, = 0, - = o and the angle between the regression lines is tar . Find the coefficient of correla...
A:
Q: From Open Intro Statistics) The National Survey of Family Growth conducted by the Center for Disease...
A:
Q: The first four moments of a distribution about x=2 are 1, 2.5, 5.5 and 16. Calculate the four moment...
A:
Q: Solve the problem by using Pearson r
A: Given: STUDENT X Y A 5 6 B 7 15 C 9 16 D 10 12 E 11 21 F 12 22 G 15 8 H 17 27 ...
Q: Suppose that X,,X2. are random variables. The following quantities are random variables lim sup X, a...
A: @solution::::
Q: If the odds for a certain event are 5 to 19, what is the probability of the event occuring? Write yo...
A: GivenOdds for a certain event are 5 to 19
Q: Grades on the first exam in a statistics class was normally distributed with a mean of 84 and a stan...
A:
Q: If you randomly select a card from a well-shuffled standard deck of 52 cards, determine the probabil...
A:
Q: Find the critical value tc for the confidence level c=0.99 and sample size n=19. tc=
A: Ans#- Find the critical value tc for the confidence level c=0.99 and sample size n=19.
Q: One thousand raffle tickets are sold at P100 each for a prize of a colored television values at P15,...
A: Given that Number of raffle tickets sold (n) = 1000 Each ticket price = P100 Price of the prize = P...
Q: advertising executive wants to estimate the mean weekly amount of time consumers spend watching trad...
A: We have given that Standard deviation =26 Margin of error =E = ±5 99% confidence interval.
Q: To test the intelligence of 10th class boys and girls in a Higher Secondary School, a sample of 83 t...
A:
Q: In this part of the question, you should calculate the required confidence interval by hand, using t...
A:
Q: Table 3: Significant Influence between Management Capability of Administrators and Productivity of E...
A: The following data is given: Leadership skills Productivity of employees Beta t-value P-v...
Q: The physical plant at the main campus of a large state university recieves daily requests to replace...
A:
Q: Heights of men on a baseball team have a bell-shaped distribution with a mean of 180cm and a standa...
A:
Q: 3. Consider the above Frequency Distribution of Salaries. Salary Frequency Percentage 41,000 50,000 ...
A: Note Hi, thank you for the question. As per our company guideline, we are supposed to answer the onl...
Q: Refer to the given problem in answering numnbers 6-8. 6. The random variable Y representing the numb...
A:
Q: A doctor records height and weight for her patients. The correlation between height and weight is 0....
A: Given that, The slope and intercept values are,
Q: A researcher is interested in finding a 95% confidence interval for the mean number of times per day...
A: Solution: Given information: n= 112 Sample size x = 26.7 Sample mean s = 24.5 Sample standard devia...
Q: [Data Set: L06028] The following sample of 16 measurements was selected from a population that is ap...
A:
Q: Does data reduction and balancing the target variable eliminate skewness?
A: In AI, while building an order model with information having undeniably a bigger number of cases of ...
Q: Consider the following regression model: Y; = Bo + B1X11 + B2X2¡ + B3X3¡ + B4X4i + U¿ We want to tes...
A: From the given information, The regression model is, Yi=β0+β1X1i+β2X2i+β3X3i+β4X4i+ui And H0:β2=β3 a...
Q: The highway fuel economy of a 2016 Lexus RX 350 FWD 6-cylinder 3.5-L automatic 5-speed using premium...
A:
Q: An American roulette wheel has 38 slots: 18 red, 18 black, and 2 green. What are the odds for the b...
A: an american roulette wheel has 38 slots: 18 red , 18 black, 2 greennow , we know :-P(R)=P(landing in...
Q: The average amount of money spent for lunch per person in the college cafeteria is $6.52 and the sta...
A:
Q: he number of computer shutdowns during any month has a Poisson distribution, averaging 0.25 shutdown...
A: Given : The no. of computer shutdowns during any month has a Poisson dist. , averaging0.25 shutdowns...
Q: Deseasonalise the following data with the help of the seasonal data given below. Seasona! Index Mont...
A:
Q: What is the relationship between B1, ôxy, and ô? Express this relationship mathematically. Could ôXY...
A: Let Y=β0^+β1^X be an estimated simple linear regression. Then, the covariance of X and Y will give t...
Q: „The number of employees, wages per employee and the variance of the wage per employee for two facto...
A:
Q: In a recent study on world happiness, participants were asked to evaluate their current lives on a s...
A:
Q: John wants to compare two means. His sample statistics were x, = 22.7, s, = 5.4, n, = 9 and x2 Assum...
A: We have given that Sample size n1=9 , n2= 9 Sample mean xbar1 =22.7 , xbar2 = 20.5 s12=5.4 , s22=3....


Trending now
This is a popular solution!

Step by step
Solved in 4 steps with 1 images

- For the following exercises, use Table 4 which shows the percent of unemployed persons 25 years or older who are college graduates in a particular city, by year. Based on the set of data given in Table 5, calculate the regression line using a calculator or other technology tool, and determine the correlation coefficient. Round to three decimal places of accuracyHere is a bivariate data set.x y71 461 555 6148 -876 3126 7074 -62 Find the correlation coefficient and report it accurate to four decimal places.r =From the data of the following table: Calculate Spearman's rank correlation coefficient between x and y and determine its type. s
- With the following data in 6 cities, calculate the coefficient of correlation by Pearson’s method between the density of population and death rate:Cities ABCDEF Area in sq. kilometre 150 Population in ‘000’ 30 No. of Deaths 300180 100 60 120 80 9040427224 1440 560 840 1224 312Compute r, the correlation coefficient, using the following data. R=_____ (round to three decimal places)Listed below are the overhead widths (in cm) of seals measured from photographs and the weights (in kg) of the seals. Construct a scatterplot, find the value of the linear correlation coefficient r, and find the critical values of r using α=0.05. Is there sufficient evidence to conclude that there is a linear correlation between overhead widths of seals from photographs and the weights of the seals? Overhead Width 7.0 7.6 9.6 9.2 8.8 8.3 Weight 111 159 242 193 205 187
- Find the coefficient of determination, given that the value of the linear correlation coefficient, r, is 0.681. (Round to four decimal places.)Listed below are the overhead widths (in cm) of seals measured from photographs and the weights (in kg) of the seals. Construct a scatterplot, find the value of the linear correlation coefficient r, and find the critical values of r using α=0.01. Is there sufficient evidence to conclude that there is a linear correlation between overhead widths of seals from photographs and the weights of the seals? Overhead Width 7.1 7.7 9.7 9.4 8.7 8.3 Weight 111 201 242 204 197 192 Construct a scatterplot. Choose the correct graph below. The linear correlation coefficient is r=enter your response here. (Round to three decimal places as needed.) The critical values are r=enter your response here. (Round to three decimal places as needed. Use a comma to separate answers as needed.)Listed below are the overhead widths (in cm) of seals measured from photographs and the weights (in kg) of the seals. Construct a scatterplot, find the value of the linear correlation coefficient r, and find the critical values of r using α=0.01. Is there sufficient evidence to conclude that there is a linear correlation between overhead widths of seals from photographs and the weights of the seals? Overhead Width 7.1 7.6 9.7 9.4 8.8 8.2 Weight 111 198 246 204 202 185 Construct a scatterplot. Choose the correct graph below. (inserted as picture) The linear correlation coefficient is r=__________ (Round to three decimal places as needed.) The critical values are r= (_______,________) (Round to three decimal places as needed. Use a comma to separate answers as needed.) Because the absolute value of the linear correlation coefficient is (greater,less than, equal to) than the positive…
