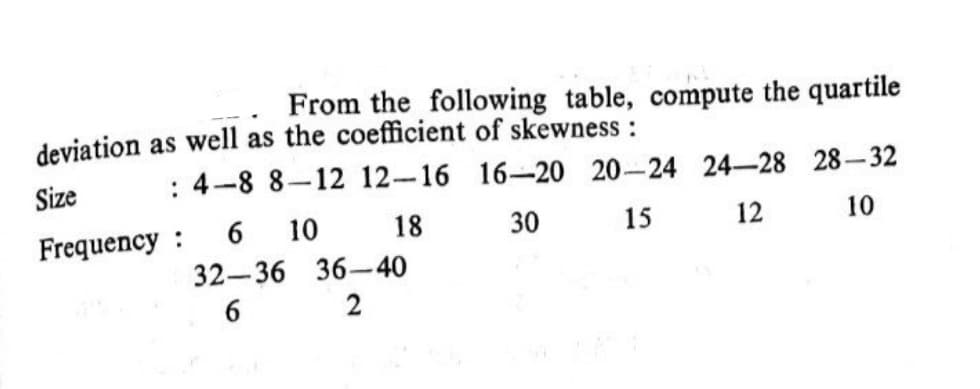
From the following table, compute the quartile deviation as well as the coefficient of skewness : Size : 4-8 8-12 12-16 16-20 20-24 24-28 28-32 Frequency : 6. 10 18 30 15 12 10 32-36 36-40 6. 2


Q: Find the cumulant generating function of gamma distribution and obtain various cumulants.
A:
Q: A bag contains 25 balls marked 1 to 25. One bau is arawn at randam. What is the probability that it ...
A:
Q: Find the margin of error for a 95% Cl if p = 0.821, and n = 182.0.
A:
Q: If the observed value is 7, the expected value is 3.5, and the standard error is 2, then the z value...
A: Here use z score formula for Z value
Q: Estimate the missing term in the following table : X Y 1 2 2 3 4 4 5 ? 32
A:
Q: A baseball team has 33 players, 8 of whom bat left-handed. Suppose that the manager of this team is ...
A:
Q: For Questions 1 and 2. Describe a method for using a table of random digits to obtain the rand sampl...
A: (1) Five people from a group of 30.
Q: Answer should include R code Use Boston Hosing data, which is called “Boston” part of MASS libra...
A: R-code for entire que : > library(MASS)> ?Boston> y<-Boston$medv> x1<-Boston$lstat...
Q: 2. Consider the following data representing the life in hours of incandescent bulbs. 1,067 919 1,196...
A: Since you have posted a question with multiple sub-parts, as per our guidelines we have provided ans...
Q: Location Variety 1 2 3 4 5 6 A 35.3 31.0 32.7 36.8 37.2 33.1 30.7 32.2 31.4 31.7 35.0 32.7 C 38.2 33...
A: Data is given for A, B, C, D, E, F We have to calculate SSE
Q: The following figure is a normal curve that represents the approximate heights, in inches, of adult ...
A:
Q: Air Canada is hosting a special sale and offers a discount if you buy a round way trip ticket instea...
A:
Q: The following table shows the amount spent by four U.S. airlines to fly one available seat i mile in...
A: The objective of the problem is to find out the number of empty seats in United Continental, America...
Q: 12 Question 1 As sample size gets large enough (n > 30) sampling distribution becomes 1. almost norm...
A: We know that Sample size n > 30 then what distribution we use.
Q: Here are histograms of the values taken by three sample statistics in several hundered samples from ...
A: Given that histograms of the values taken. by three sample statistics in several hundered samples f...
Q: 3 Question Samples according the object selection method can be divided to : 1. Random and non rando...
A: Given problem Given that Samples according the object selection method can be divided to : Ans) ...
Q: a) Find the mean? b) Find the median? c) Find the mode?
A: Here AS PER POLICY I HAVE CALCULATED 3 SUBPARTS The following data was the exam scores (out of 100 ...
Q: For a certain frequency table which is partly réproduced here, the mean was found to be 1'46. No, of...
A:
Q: Based on the regression results, answer the following questions* A sample of data is collected (from...
A: There are 6 independent variable in the given output. CEOANN, EMPL, MKTVAL, and EPSIN are all signi...
Q: A retailer has 10 identical television sets of a company out which 4 are defective. If 3 televisions...
A: here total television sets 10 of which 4 are defective here use hypergeometric distribution because ...
Q: What is the probability of flipping a coin five times and it landing on Heads all five times? Do not...
A:
Q: of 100 observations 0.49 -012Y,+0,54AY,. the numbers in parentheses are standard erors and where the...
A: Unit root tests are tests for determining the stationarity property in the model of time series. Uni...
Q: The mean weight of 150 students in a class is 60 kg. The mean weight of boys in the class is 70 kg. ...
A: Let x̄1 be the mean of Boys x̄2 be the mean of girls n1 be the number boys in the class n2 be th...
Q: Calculate mean deviation (take deviation from mean) from the following data : x 2 4 6 Ĵ 1 4 6 8 10 4...
A:
Q: The monthly phone bills in a city are normally distributed with a mean of 38.5$ and a standard devia...
A:
Q: Test the difference in means with two populations when o is known 1. Two independent random samples ...
A: The average salaries are truly indifferent at the population level is to be tested, using the sample...
Q: A new railroad is proposed to be built between Canada and the USA. A survey of the opinions about th...
A:
Q: Find the median deviation arnd the mean coeffi- cient of disperion from median of the following seri...
A:
Q: - In a city, the daily consumption of milk in excess of 20,000 gallons is approximately exponentiall...
A:
Q: QUIZ (1/2 CW). Let X be a discrete random variable and S = {1,2,3,4,5,6,7} be its support. With the ...
A: Probability : Probability is a field of mathematics that deals with numerical descriptions of how pr...
Q: Find P (-1.26 < z < 3.25). Round your answer to 4 decimal places.
A:
Q: Based on the regression results, answer the following questions ** A sample of data is collected (fr...
A:
Q: Using the concept of mean, which of three best options has the best deal? Explain your answer.
A: here use concept of expected value(mean) X= return from company A Y= return from company B Z= return...
Q: Tennis balls are randomly toss into one of five trays. Determine the number of balls needed to ensur...
A:
Q: From the data, identify the best point estimate of the population mean and 95% confidence interval o...
A: We know that, The best point estimate of the population mean is sample mean .
Q: 1. A random sample of size of 25 taken with replacement from a population of 1,000 with u = 20 and o...
A: Given: 1. Sample size, n=25Population size, N=1000μ=20σ2=9 2. Sample size, n=58Population size, N=1...
Q: An experiment consists of asking 3 women at random if they wash their dishes with brand X detergent....
A: Given that, An experiment consists of asking 3 women at random if they wash their dishes with brand ...
Q: The reading speed of second grade students in a large city is approximately normal, with a mean of 9...
A: Given that Let X denotes the reading speed of second grade students X~N(mean=91, standard deviat...
Q: The sampling distribution of P is closely related to the normal distribution. True or False True Fal...
A:
Q: : Find Karl Pearson's coefficient of correlation between the values of X and Y given below and calcu...
A:
Q: If S = { x | 0 8 }, find a. A ∩ B b. B U C' c. A U ( B ∩ C’)
A: Given : If S = { x | 0 < x < 25 }, A = { x | 5 < x < 12 }, B = { x | 2 < x < 9 } a...
Q: A plant manufactures IC chips that are packed 27 to a box. Suppose that a specific box contains 7 de...
A:
Q: In this question, the real numbers in your answers should be given with three significant digits of ...
A: Given information: It is given that the public health authorities of small town have divided the pop...
Q: Problem 8. The following table gives the heights of students in á class. Find out the quartile devia...
A:
Q: attend physical fitness sessions? - The average weight of 1,000 3-year-old female toddlers from a ce...
A: 2) We have given that. X~N( μ , ?^2 ) μ =14 , ? =2 Z-score =( x - μ )/?
Q: Little Peten'ka refuses to eat broken spaghetti, so his monm wants so compare two brands "M" and "A"...
A: Given that, Little Peten 'ka refuses to eat broken spaghetti, so his mom wants so compare two brands...
Q: *H is Mean of population O Mean of sample Mode O
A: We have to identify for which given term notation is used.
Q: A manager accepts the work submitted by his typist only when there is no mistake in the work. The ty...
A: Given that, A manager accepts the work submitted by his typist only when there is no mistake in the ...
Q: If the p-value is greater than a ,we do not reject the null hypothesis (p > * (a True False
A:

Step by step
Solved in 4 steps with 4 images

- You sample 1500 dung beetles in a population for 2 alleles A1 and A2 and get the following data: A1A1 825 individuals A1A2 525 individuals A2A2 135 Individuals Is this population in Hardy Weinberg Euilibrium, use a chi square test to determine?Suppose that we want to compare the cholestrol contents of four competing diet foods on the basis of the following data (in milligrams per package) which were obtained for three 6-ounce packages of each of the diet foods: Diet food A: 3.6 4.1 4.0 Diet food B: 3.1 3.2 3.9 Diet food C: 3.2 3.5 3.5 Diet food D: 3.5 3.8 3.8 a)Fill in the blanks below. b)Test at the 0.05 level of significance whether the differences among means obtained for the four competing diet foods (Diet A, B, C, D) are significant? (Ftable=4.07) ONE-WAY ANOVA TABLE Source of Variation Degrees of Freedom Sum of Squares Mean Square F Treatments ? 0.54 ? ? Error ? ? ? Total ? 1.18Suppose that we want to compare the cholestrol contents of four competing diet foods on the basis of the following data (in milligrams per package) which were obtained for three 6-ounce packages of each of the diet foods: Diet food A: 3.6 4.1 4.0 Diet food B: 3.1 3.2 3.9 Diet food C: 3.2 3.5 3.5 Diet food D: 3.5 3.8 3.8 Fill in the blanks below. Test at the 0.05 level of significance whether the differences among means obtained for the four competing diet foods (Diet A, B, C, D) are significant? (Ftable=4.07) source of varation degrees of freedom sum of squares mean squares F treatments ? 0.54 ? ? error ? ? ? total ? 1.18
- The number of contaminating particles on a silicon waferprior to a certain rinsing process was determined for eachwafer in a sample of size 100, resulting in the followingfrequencies:Number of particles 0 1 2 3 4 5 6 7Frequency 1 2 3 12 11 15 18 10Number of particles 8 9 10 11 12 13 14Frequency 12 4 5 3 1 2 1a. What proportion of the sampled wafers had at leastone particle? At least five particles?b. What proportion of the sampled wafers had betweenfive and ten particles, inclusive? Strictly between fiveand ten particles?c. Draw a histogram using relative frequency on thevertical axis. How would you describe the shape of thehistogram?a major cereal manufacturer is awarding prize certificates in its #1 cereal. a random sample of 60 cereal boxes is selected and 5 are found to contain prize certificates. find the 90% C.I for the true proportion of prize certificates.A researcher was interested in studying if there is a significant relationship between the severity of COVID 19 and blood types of individuals. 2400 individuals were studied and the results are shown below. blood types condition O A B AB Total critical 64 44 20 8 136 severe 175 129 50 15 369 moderate 211 528 151 125 1015 mild 200 400 140 140 880 total 650 1101 361 288 2400 a. State both the null and alternative hypotheses. b. Provide the decision rule for making this decision. Use an alpha level of 5%. c. Show all of the work necessary to calculate the appropriate statistic. d. What conclusion are you allowed to draw? e. Would your conclusion change at the 10% level of significance? [2 marks]
- The size of leaves taken from bramble bushes were measured to see if there is adifference between the size of the leaves growing in full sunlight and those growing inthe shade. Test the hypothesis using 0.05 level of significance.Width Of Leaf / Cm Sunlight6.0 4.8 5.1 5.5 4.1 5.3 4.5 5.1Shade 6.5 5.5 6.3 7.2 6.8 5.5 5.9 5.5 is this a wilcoxon test or mann whitney test ? and how do i do this question in hand calculation method. attached ceritical table for the two testsA research center claims that that 31% of adults in a certain country would travel into space on a commercial flight if they could afford it. In a random sample of 1200 adults in that country, 33% say that would travel into space on a commercial flight if they could afford it. At alpa= 0.05, isthere enough evidence to reject the research centers claim complete parts a through d belowA researcher was interested in studying if there is a significant relationship between the severity of COVID 19 and blood types of individuals. 2400 individuals were studied and the results are shown below. Condition Blood Type O A B AB Total Critical 64 44 20 8 136 Severe 175 129 50 15 369 Moderate 211 528 151 125 1015 Mild 200 400 140 140 880 Total 650 1101 361 288 2400 a. State both the null and alternative hypotheses.b. Provide the decision rule for making this decision. Use an alpha level of 5%. c. Show all of the work necessary to calculate the appropriate statistic.d. What conclusion are you allowed to draw?e. Would your conclusion change at the 10% level of significance?f. Confirm test results in part (c) using JASP. Note: All JASP input files and outputtables should be provided
- A researcher was interested in studying if there is a significant relationship between the severity of COVID 19 and blood types of individuals. 2400 individuals were studied and the results are shown below. Condition Blood Type O A B AB Total Critical 64 44 20 8 136 Severe 175 129 50 15 369 Moderate 211 528 151 125 1015 Mild 200 400 140 140 880 Total 650 1101 361 288 2400 a. State both the null and alternative hypotheses. b. Provide the decision rule for making this decision. Use an alpha level of 5%. c. Show all of the work necessary to calculate the appropriate statistic. d. What conclusion are you allowed to draw? e. Would your conclusion change at the 10% level of significance?A researcher is using a two-tailed hypothesis test with α = 0.01 to evaluate the effect of a treatment. If theboundaries for the critical region are t = ± 2.845, then how many individuals are in the sample?A. n = 23B. n = 22C. n = 21D. n = 20E. cannot be determined from the information givenA recent poll found that 664 out of 1026 randomly selected people in a particular country felt that colleges and universities with big sports programs placed too much emphasis on athletics over academics. Assuming the conditions for the CLT are met, use the accompanying Minitab output to complete parts a and b below. N Event Sample p 95% CI for p 1026 664 0.647173 (0.617934, 0.676413) Question content area bottom b. Suppose a sports blogger wrote an article claiming that a majority of adults from this country believe that colleges and universities with big sports programs place too much emphasis on athletics over academics. Does this confidence interval support the blogger's claim? Explain your reasoning. A. No, it is not a plausible claim because the confidence interval contains 50%. B. No, it is not a plausible claim because the confidence interval does not contain only values above 50%. C. Yes, it is a…


