From the problem 'try it yourself 2' the frequency distribution is as follows: Class Frequencyf Mid point Cumulative frequency 17 14-20 8 21-27 15 28-34 14 35-41 7 42-48 4 49-55 3 Σf=51 24 31 38 45 52 8 23 37 44 48 51
Q: The frequency distribution shows the results of 200 test scores. Are the test scores normally…
A: Given data is Class Lower Boundaries Class Upper Boundaries Frequency 49.5 58.5 19 58.5 67.5…
Q: You wish to test the following claim (Ha) at a significance level of a = 0.02. Ho: P₁ = P2 Ha: P1 P2…
A:
Q: Researchers are trying to determine if there is a difference in the average lifespan of two species…
A: Given:Sample size (n1)=105Sample mean(x¯1)=51Sample standard deviation (s1)=7Sample size…
Q: he New York Times ran an article about a study in which Johns Hopkins researchers subjected…
A: Given, For vinyl gloves : sample proportion (p1^) = 0.63 sample size (n1) = 240 For latex group…
Q: 3. Using multiple linear regression, estimate the values of a, b and c in the given regression…
A: The data set is given as: x y 1 3.6 2 5.2 3 6.8 4 8.8 The equation is given as:…
Q: During one of the field case-control study of smoking and lung ca istorically important study…
A: Given Information: F indicates the number of people with lung cancer. G indicates the number of…
Q: Select all the answers that are associated with the p value Type I error alpha significance level…
A: P-value : P-value is a statistical measurement used to validate a hypothesis against a observed…
Q: (a) The function f(x) is a valid density function because (b) F(x)= x≤ 1, x> 1. for all (c) P(X> 5)=…
A:
Q: Words were displayed on a computer screen with background colors of red and blue. Results from…
A: Given that Sample sizes n1=35 , n2=36 Standard deviation s1=5.91 , s2=5.42
Q: DO NOT ROUND OFF UNTIL YOU GET TO THE ANSWER A randomly selected sample of college basketball…
A: The following sample data is given:…
Q: A random sample of 200 students is taken at the park in order to determine the proportion who smoke…
A: Given data n=200 x=150 confidence interval is 95%
Q: You wish to test the following claim (Ha) at a significance level of a = 0.02. Ho: P1 = P2 Ha: P1 P2…
A: From the provided information,
Q: Calculate and discuss the followings. Please provide the steps for the calculation and highlight the…
A: Measure of central tendency are used to summarize the data set. Some of the measures of central…
Q: rts (a) through (d) belo 2+2 1².1 0sx elsev X), Var(Y), and Cov(X) r answers.) 7 r answer.)
A: The joint probability density function for (x,y) is given below f(x,y)=94x2+34y2 0≤x,y≤10…
Q: 1 example solution of mean and variance using Negative Binomial Distribution.
A:
Q: In the formula to calculate the coefficient of determination, p² St-Sr St = 9 St denotes O…
A:
Q: How did you come to the conclusion for the relative frequencies numbers being 0.5, 0.10, etc?
A:
Q: Two samples are taken with the following numbers of successes and sample sizes r₁ = 23 r₂ = 34 n₁ =…
A: The provided information is α=0.09 r1=23 r2=34 n1=82 n2=76 The sample proportion is…
Q: Amanda recently switched her primary doctor to one specializing in caring for elderly patients. On…
A: The following information has been given: μ=115 s=23x¯=123 n=17
Q: 1. Determine the missing values represented by W, X, Y, and Z. A W = 118; X = 102; Y = 35 450 and…
A:
Q: If (-5.6, 1.8) is an interval on the number line, find the value that is in the middle of the…
A: The interval on the number line is (-5.6,1.8)
Q: Match the probabilities with their values. Z is a Random Variable which has a standard normal…
A: Match the probabilities with their values. Z is a Random Variable which has a standard normal…
Q: Suppose we are testing the hypotheses Ho: p = 0.6 and Hap<0.6. Our sample of size 107 contains 81…
A: Given x=81 n=107 P=0.6
Q: An automatic teller machine card has a four-digit personal identification number (PIN). It is known…
A: The question is about counting theory and probability Given : A card has 4 digit PIN First 2 digits…
Q: Test the claim that the proportion of men who own cats is smaller than the proportion of women who…
A: From the provided information,
Q: A random sample of 16 graduates of a certain secretarial school typed an average of 81.3 words per…
A: From the provided information, Sample size (n) = 16 Sample mean (x̄) = 81.3 Standard deviation (s) =…
Q: 3. In genetic investigations, one frequently samples from a binomial distribution. Except that…
A: we have given truncated binomial distribution f(x) = mCxpx(1-p)m-x1-(1-p)m and we have to find the…
Q: Express the confidence interval 0.555 <p < 0.999 in the form p + E. p±E= ±
A: Given: Confidence interval = 0.555 < p < 0.999 Formula Used: Confidence interval = p^ ± E…
Q: 18.) A type-K thermocouple with special limit error was used for measuring the temperature of a hot…
A:
Q: (a) k= (b) Complete the definition of F(x). (Type an integer or a simplified fraction.) F(x)=<x< x 2…
A:
Q: DISCUSS THE FOLLOWING SOLUTION 1) Given : The highest and lowest temperature is given as : HT LT…
A: Explanation: Mean: Mean shows the average value of the data set. Median: Median represents the…
Q: Find z such that 85% of the standard normal curve lies to the left of z. (Round your answer to two…
A: Standardized z-score: The standardized z-score represents the number of standard deviations the…
Q: You wish to test the following claim (HaHa) at a significance level of α=0.005α=0.005.…
A: Given that H0 : p = 0.5 Vs H1 : p ≠ 0.5 X = 85 , n = 190 , α=0.005
Q: Last week, your manager asked you to analyze staffing needs for the foreclosure department. She was…
A: The question is about hypo. testing Given : Popl. mean no. of documents processed ( μ ) = 15.11 per…
Q: 3. In genetic investigations, one frequently samples from a binomial distribution. Except that…
A:
Q: It is decided to test if BSE provides a greater chance of early detection compared to accident.…
A: Chi square test are used to measure the independency, testing variance and goodness of fit. Here,…
Q: Beware the dangers of google. Google is a great tool, but it is necessary to be skeptical and…
A: We know that, sample is the the subset of the population. And standard error calculated for two…
Q: ) Find the expected value (mean) and the variance for the following distribution. Probability…
A: According to our guidelines, we can answer only first question. So, please repost the rest question.
Q: Which of the following is a correct statement? A The discrepancy between the sample and the…
A:
Q: A decade-old study found that the proportion,p, , of high school seniors who believed that "getting…
A: The question is about hypo. testing Given : Popl. prop. of high school seniors who believed that "…
Q: 6. Let X₁, X₂, ..., X₁ be a random sample from Normal(0,0), 0 > 0. Propose a pivotal quantity and…
A: Given that X1, X2, . . ., Xn be a random sample from Normalθ,θ, θ>0.
Q: The equation for the regression line is Ŷ = 2.5X + 12 where X represents assertiveness and Y…
A: The question is about interpretation of slope in reg. eq. Given reg. eq. : Y^ = 2.5 X + 12 Where, X…
Q: 2. Random variables X and Y have joint PDF fx,x(x, y) = ce¯(57)-(1³) What is the constant c? Are X…
A:
Q: Using multiple linear regression, estimate the values of a, b and c in the given regression model.…
A:
Q: A conditional Probability: P(A | B) is asking what is the probability we get event A if we know that…
A: There are 5 red balls, 7 green balls, and 8 purple balls.
Q: You are conducting a study to see if the probability of a true negative on a test for a certain…
A: According to the given information in this question We need to find test statistic and p value of…
Q: Using the sample data in Table 1 above, determine the standard deviation of the daily consumption of…
A: The question is about grouped freq. dist. Given :
Q: You are conducting a study to see if the probability of a true negative on a test for a certain…
A: Given P=0.85 x=361 p=415
Q: Which of the following values is most likely to represent the correlation coefficient for the data…
A: The objective is to define the appropriate value of r (i.e., the correlation coefficient; -1≤r≤1)…
Q: PROBLEM 1 (A-D): Compute the Median and Range in terms of Age using the Raw Data of 40 patients.…
A: Since you have asked multiple questions, we will solve the first question for you. If you want any…
Why is the culmative frequency in 10's? Why does it go up to 60?
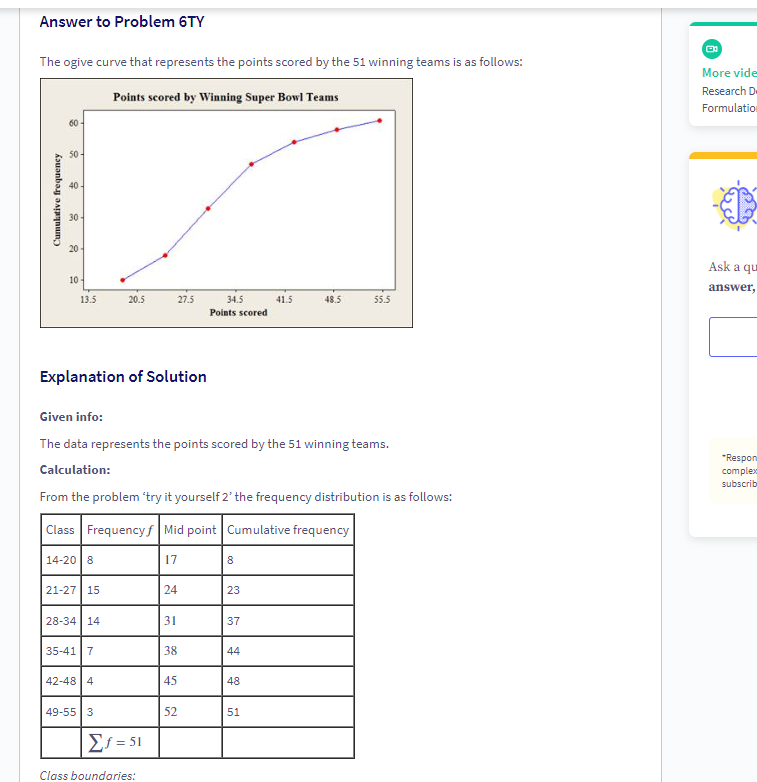
Trending now
This is a popular solution!
Step by step
Solved in 2 steps
Why does the class go from 14-20 instead of 14-19 like the textbook shows? The textbook provides 7 classes but in your answer, it goes down to 6 classes. What is the reason for this? Thank you :)
- Olympic Pole Vault The graph in Figure 7 indicates that in recent years the winning Olympic men’s pole vault height has fallen below the value predicted by the regression line in Example 2. This might have occurred because when the pole vault was a new event there was much room for improvement in vaulters’ performances, whereas now even the best training can produce only incremental advances. Let’s see whether concentrating on more recent results gives a better predictor of future records. (a) Use the data in Table 2 (page 176) to complete the table of winning pole vault heights shown in the margin. (Note that we are using x=0 to correspond to the year 1972, where this restricted data set begins.) (b) Find the regression line for the data in part ‚(a). (c) Plot the data and the regression line on the same axes. Does the regression line seem to provide a good model for the data? (d) What does the regression line predict as the winning pole vault height for the 2012 Olympics? Compare this predicted value to the actual 2012 winning height of 5.97 m, as described on page 177. Has this new regression line provided a better prediction than the line in Example 2?17. In Problem 11 from the previous section, westated that the damage amount is normally distributed. Suppose instead that the damage amount istriangularly distributed with parameters 500, 1500,and 7000. That is, the damage in an accident canbe as low as $500 or as high as $7000, the mostlikely value is $1500, and there is definite skewnessto the right. (It turns out, as you can verify in @RISK,that the mean of this distribution is $3000, thesame as in Problem 11.) Use @RISK to simulatethe amount you pay for damage. Run 5000 iterations. Then answer the following questions. Ineach case, explain how the indicated event wouldoccur.a. What is the probability that you pay a positiveamount but less than $750?b. What is the probability that you pay more than$600?c. What is the probability that you pay exactly $1000(the deductible)?Question 10 Consider an operational process in a factory where widgets are produced. As the process is not perfect, errors sometimes happen, and the errors are either technical or human. Over the last 100 days, errors were observed and recorded. On any given day, there occurred zero to three (0 to 3) human errors and zero to three (0 to 3) technical errors. The frequency distribution of errors is given in the following contingency table. Number of human errors No. of Tech Errors 0 1 2 3 Total 0 8 6 4 4 22 1 5 8 9 10 32 2 4 5 10 8 27 3 0 3 4 12 19 Total 17 22 27 34 100 What is the probability of 0 technical errors given 3 human errors? State your answer as a decimal value rounded to two digits after the decimal point.
- The company "TRAMAD" is conducting a study on the variation of the prices of its shares, listed on the Santiago Stock Exchange. For this purpose, it takes a sample of prices corresponding to the last 30 working days. The value indicated is the one that has been registered at the closing time of the operations: 450 540 280 440 350 720 400 190 410 700 600 500 250 780 290 580 320 220 320 660 300 360 320 605 180 300 210 520 290 420 a) Make a frequency table. b) TRAMAD estimates that your situation is not alarming if the percentage of days in which prices were less than or equal to $400 is less than 30%. What do you say Is this company's situation alarming or not? Explain. c) Calculate the mean and standard deviation. d) Calculate and interpret the quartile 1.The data in the table characterizes the income distribution for a country. Income category Share of income (%) Cumulative share of income (%) first quintile 7.0 --- second quintile 9.0 16.0 third quintile --- 37.0 fourth quintile 25.0 --- fifth quintile 38.038.0 --- What percentage of the total population is categorized as belonging to the second quintile? Give your responses as whole numbers. Percentage of population in second quintile:__________% What percentage of the total income for the country is earned by the third quintile? Percentage earned by the third quintile:__________% What is the cumulative share of income earned by the poorest 80% of the population? Percentage earned by the poorest 80%:__________%POS QUES 2Z-test Problem #2: The ABC Tire Company claims that the average lifetime oftheir tires is at least 28,000 km. To check the claim, a taxi company puts 40of these tires on its taxis and gets a mean lifetime of 25,560 km with astandard deviation of 1,350 km. Is the claim true? Test at 5% level ofsignificance.Please show the complete and correct solution and answer.Correct test statistics: 11.43
- Referring to Problem 1, test at the 5% level of significance: H0: μ = 800 versus H1:μ != 800. What is the power of the test at μ = 795 and at μ = 805? Question Referred too An existing process used to manufacture paint yields daily batches that have beenfairly well established to be normally distributed with mean μ = 800 tons, σ = 30tons. A modification of this process is suggested with the view of increasing production. Assume that the daily yields, using the modified process, are distributedas N(μ,(30)2), and suppose that a sample taken on 100 randomly chosen days ofproduction using the modified process yields an average of X¯ = 812 tons. Test at the1% level of significance H0: μ = 800 versus H1: μ > 800. What is the power of thetest at μ = 810? Graph the power function.Problem 6 The compressive strength of concrete is being tested by a civil engineer. She tests 12 specimens and obtains the following data (in psi): 2213, 2256, 2247, 2203, 2225, 2304, 2289, 2287, 2312, 2252, 2274, 2295. Part a Assuming that the compressive strength is normally distributed, test the hypothesis that the mean strength is at least 2250 psi. Part b Refer to Problem 6. Now assume that the compressive strength is not normally distributed, and test the hypothesis that the median strength is at least 2250 psi. One way to do this is to notice that if the median is 2250 psi, then you can count how many of the samples have strengths above and below that value—i.e., the proportion of samples greater than 2250—compared to the proportion you would expect if the true median were indeed 2250 psi. If you view the data as being either above or below the median, you can calculate the related P-value. Refer to Problem 6. Are the P-values from (a) and (b) similar? If not, can you…he following data are measurements of temperature (x = °F) and chirping frequency (y = chirps per second) for the striped ground cricket. Temperature 31.4 22.0 34.1 29.1 27.0 24.0 20.9 27.8 Frequency 20.0 16.8 19.9 18.2 17.4 15.5 14.6 17.4 Temperature 20.8 28.5 26.4 28.1 27.0 28.6 24.6 Frequency 15.3 16.1 15.3 17.8 16.3 17.1 14.3 Find the best-fitting line for the data. (Round your values to three decimal places.