From the regression equation, what is the predicted percentage increase in sales when the advertising campaign cost is 1.50 million dollars? Round your answer to two or more decimal places. B. From the regression equation, what is the predicted percentage increase in sales when the advertising campaign cost is 1.62 million dollars?
From the regression equation, what is the predicted percentage increase in sales when the advertising campaign cost is 1.50 million dollars? Round your answer to two or more decimal places. B. From the regression equation, what is the predicted percentage increase in sales when the advertising campaign cost is 1.62 million dollars?

Linear Algebra: A Modern Introduction
4th Edition
ISBN:9781285463247
Author:David Poole
Publisher:David Poole
Chapter4: Eigenvalues And Eigenvectors
Section4.6: Applications And The Perron-frobenius Theorem
Problem 22EQ

Related questions
Question
100%
Based on the firm's data and the regression line, answer the following.
A. From the regression equation, what is the predicted percentage increase in sales when the advertising campaign cost is 1.50 million dollars? Round your answer to two or more decimal places.
B. From the regression equation, what is the predicted percentage increase in sales when the advertising campaign cost is 1.62 million dollars? Round your answer to two or more decimal places.

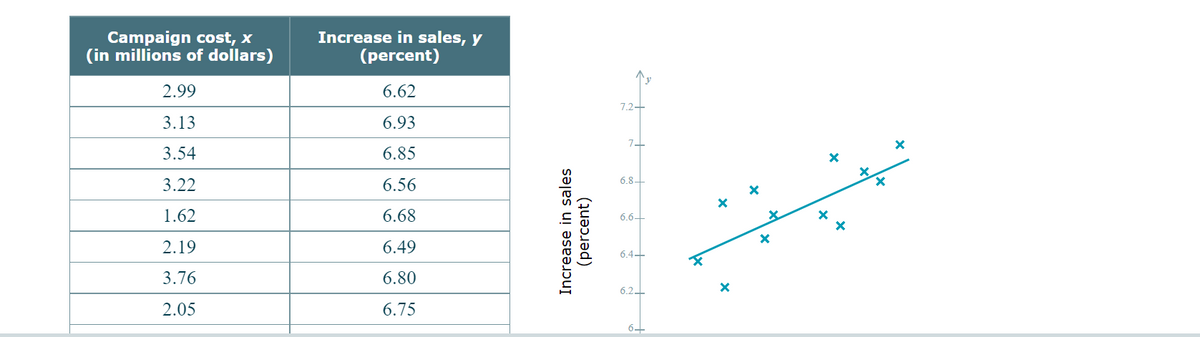
Transcribed Image Text:An advertising firm wishes to demonstrate to its clients the effectiveness of the advertising campaigns it has conducted. The following bivariate data on twelve
recent campaigns, including the cost of each campaign (in millions of dollars) and the resulting percentage increase in sales following the campaign, were
presented by the firm. Based on these data, we would compute the least-squares regression line to be y = 6.17+0.18x, with x representing campaign cost
and y representing the resulting percentage increase in sales. (This line is shown below, along with a scatter plot of the data.)
Transcribed Image Text:Campaign cost, x
(in millions of dollars)
2.99
3.13
3.54
3.22
1.62
2.19
3.76
2.05
Increase in sales, y
(percent)
6.62
6.93
6.85
6.56
6.68
6.49
6.80
6.75
Increase in sales
(percent)
7.2+
7-
6.8
6.6-
6.4-
6.2
6+
X
X
X
X
Expert Solution
This question has been solved!
Explore an expertly crafted, step-by-step solution for a thorough understanding of key concepts.

Step by step
Solved in 3 steps

Recommended textbooks for you
Linear Algebra: A Modern Introduction
Algebra
ISBN:
9781285463247
Author:
David Poole
Publisher:
Cengage Learning

Functions and Change: A Modeling Approach to Coll…
Algebra
ISBN:
9781337111348
Author:
Bruce Crauder, Benny Evans, Alan Noell
Publisher:
Cengage Learning
Linear Algebra: A Modern Introduction
Algebra
ISBN:
9781285463247
Author:
David Poole
Publisher:
Cengage Learning
Functions and Change: A Modeling Approach to Coll…
Algebra
ISBN:
9781337111348
Author:
Bruce Crauder, Benny Evans, Alan Noell
Publisher:
Cengage Learning