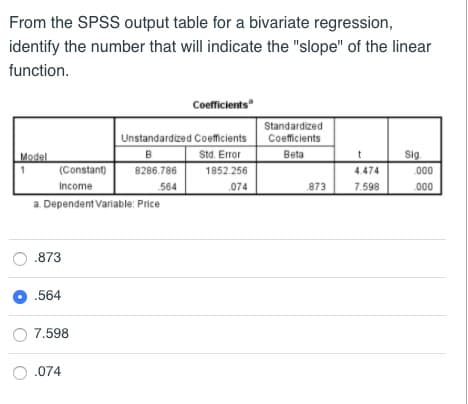
From the SPSS output table for a bivariate regression, identify the number that will indicate the "slope" of the linear function. Model 1 (Constant) Income a. Dependent Variable: Price O.873 O.564 7.598 O.074 Coefficients Unstandardized Coefficients B 8286.786 564 Std. Error 1852.256 074 Standardized Coefficients Beta 873 t 4.474 7.598 Sig. 000 .000


Q: Given the following data set: $1.42, $1.27, $1.28, $1.48, $1.36, $1.44, $1.46, $1.32, $1.33, $1.33…
A: It is needed to find the frequency distribution table for the gasoline prices.
Q: A card is selected at random from a standard deck of 52 playing cards. Find the probability of each…
A: The experiment is with a standard deck of cards.Total no. of cards in a standard deck = 52It is…
Q: Quality Progress, February 2005, reports on improvements in customer satisfaction and loyalty made…
A: The sample size is 480 and the population proportion is 45%.
Q: Figure 1 shows the relative location map of 100 selected V and U data. V values are above the '+'…
A: The given data provides information on two variables U and V.
Q: What is the probability that you like the next four songs that are played? (Assume a song cannot…
A: Given that,Total no. of songs No. of songs like Thus, the no. of songs do not like is,To find the…
Q: N 1,679 10,451 125,100 598 999 Given the following population sizes, compute for the minimum sample…
A: Given 5 different population sizes for finding the minimum sample size using Slovin's and Cochran's…
Q: he owner of a small firm has just purchased a personal computer, which she expects will serve her…
A: Expected value can be described as an anticipated value that can be put on any event or action that…
Q: A local company providing internet services wants to analyze the demand for different internet…
A: Note: Since you have posted a question with multiple sub-parts, we will solve first three sub parts…
Q: Find the range for this list of numbers 7 31 48 94 45 87 29 10 20 67 42 24 60 12 4
A: The list of numbers is7,48,45,87,29,10,20,67,31,94,42,24,60,12,4
Q: alpha 1% alpha Cochran's Slovin's Cochran's Corrected (5% only) Adju 7
A: Given 5 different population sizes for finding the minimum sample size using Slovin's and Cochran's…
Q: Find the indicated probabilities using the geometric distribution, the Poisson distribution, or…
A: A geometric variable is a discrete random variable that counts the number of trials before a…
Q: Here is a data set: Construct a grouped frequency distribution table (GFDT) for this data set. You…
A: The grouped frequency distribution table consists of a data range with a class frequency next to it.…
Q: Determine how many possible values there are for the following discrete random variable: sum of your…
A: Given that,The experiment is of tossing two dies at a time.Let the random variable be the sum of the…
Q: Given the universal set U = {a,b. A = {t, r,i,a,n,g,l, e, s}, B = Find: • (AU(BOC)) ● ((Aºn B) nC)…
A: According to the Bartleby guidelines experts solve only one question and a maximum of three sub…
Q: Summary: This study aimed to determine whether exposure to Artificial Light At Night (ALAN) while…
A: Given the result of the study, of the 7,807 participants who said they slept with no artificial…
Q: Consider the following independent random samples that are assumed not to be normally distributed.…
A: Given data isSample 1Sample 2Sample 3302037352231362428302131 32
Q: The Bookstall Inc. is a specialty bookstore concentrating on used books sold via the Internet.…
A: According to the given information, we construct the below table,BooksPrice (Xi) Weights…
Q: A simple random sample of 40 items resulted in a sample mean of 20. The population standard…
A: n=40,σ=5
Q: Let Y be a uniform r.v. on the interval (0,1). find E[Y^k] using method of MGF. (Moment Generated…
A: Given that the random variable Y follows a uniform distribution in the interval .
Q: As items come to the end of a production line, an inspector chooses which items are to go through a…
A: P(Defective)=8%, P(Inspected|Defective)=70%, P(Inspected|Good)=15%
Q: Which scatter plot matches this residual plot? CHOICES: PLOT A, PLOT B, PLOT C What best describes…
A: Given three scatter plots Scatter Plot A, Scatter Plot B, and Scatter Plot C with their lines of…
Q: For the following population of N = 6 scores: 2, 9, 6, 8, 9, 8
A: The population of N= 6 scores is 2, 9, 6, 8, 9, 8
Q: C. P(10 < X < 17) = D. P(14 < X < 27) = #
A: X~U(a,b)a=5 ,b=22
Q: A group of 200 students have been cross classified into the following two way table in terms of…
A: Pierced not Pierced Female7355Male1557
Q: Tucson Machinery, Incorporated, manufactures numerically controlled machines, which sell for an…
A: QuarterLast yearQuantity (Units)Quarter This yearQuantity117116223229331333421420
Q: 3. The number X of telephone calls received each minute at a certain switchboard in the middle of a…
A: The observed frequency distribution of the number of telephone calls is given as…
Q: A random sample of the price of gasoline from 30 gas stations in a region gives the statistics…
A: The sample mean is 3.89, the standard deviation is 0.26 and the sample size n is 30.
Q: 1. Suppose X = (X₁,..., Xn) is a random sample from the Gamma distribution with shape a and rate 0,…
A: Since you have posted a question with multiple sub-parts, we will solve the first two sub-parts for…
Q: Let Y₁ 5).
A: let's consider P(Y50<4). Since the order statistics follow the exponential distribution, we can…
Q: A software company is interested in improving customer satisfaction rate from the 70% currently…
A: The question is about hypothesis testing.Given :Population proportion of currently claimed customer…
Q: Consider the following time series data: Quarter 1 2 3 4 Year1 6 Cyclical pattern 2 3 5 O Trend…
A: A time is a observation in sequence formation at successive points in time or over consecutive…
Q: 1.3-6. A researcher finds that, of 982 men who died in 2002, 221 died from some heart disease. Also,…
A: Given that,The researcher knows that, of 982 men who died in 2002, 221 died from some heart…
Q: (a) the probability density function f(x) = (b) the mean μ = (c) the standard deviation = II III III…
A: Given, x is a random variable best described by a uniform probability that ranges from 2 to 4.That…
Q: Thank you. I'm not sure about the result for the second question. What I'm having a hard time with…
A: Here given that a period of 8274 days there are 48 time-windows of 15 days that occur at intervals…
Q: Use the ogive to answer parts a) through d). Male Beagles Q Cumulative frequency 55- 233723222 50-…
A: It is required to use the given ogive to answer the questions on cumulative frequency.
Q: A bottler carefully weighs bottles coming off its production line to check that the system is…
A: From the given information Mean = 814&nbsp;Standard Deviation = 9Using formula,
Q: Jump to level 1 The additional growth of plants in one week are recorded for 6 plants with a sample…
A: n=6, s=2, df=n-1=6-1=5
Q: If variables X and Y are normally distributed, the distribution of X-Y X+Y U= a b C is F with (1,1)…
A: Let X and Y are normally distributed then the distribution of U=((X-Y)/X+Y)2We have to choose…
Q: Let Y, represent the ith normal population with unknown mean , and unknown variance of for i= 1,2.…
A: From the above given data the following solution is provided below:
Q: rade on Business Statistics Exam A: 90-100 B: 80-89 C: 65-79 D: 50-64 F: Below 50 Total Frequency 60…
A: It is given that a frequency distribution table.
Q: 2. Some students were asked to name the four Beatles. Their responses are displayed below. 0 4 1 2 3…
A: Students were asked to name four Beatles.The given bar graph displays the number of beatles…
Q: The following data are the amounts that a sample of 15 customers spent for lunch ($) at a fast-food…
A: 7.40, 6.29, 5.81, 6.47, 8.28, 9.46, 7.12, 6.83, 5.94, 4.89, 6.52, 5.56, 7.90, 8.28, 9.60We have to…
Q: A linear programming computer package is needed. The employee credit union at State University is…
A: In this problem, the employee credit union at State University needs to allocate $2,200,000 across…
Q: Which of the following statements is TRUE? a.)A high correlation can indicate a relationship but…
A: The objective is to identify the correct statement regrading correlation, which has been interpreted…
Q: 5.4-23. Let X be N(0,1). Use the mgf technique to show that Y = X² is x2(1). HINT: Evaluate the…
A: X~N(0,1) Then using mgf we have to prove that Y=x2 follows chi square distribution with 1 degree of…
Q: A card game is played with a deck of 18 cards which can be one of 2 suits, one of the suits being…
A: A card game is played with a deck of 18 cards. These 18 cards can be one of 2 suits i.e., hearts and…
Q: A customer service department receives on average 150 calls per day and the number of calls received…
A: The number of calls received per day is Poisson distributed with a mean of 150 calls. Since the call…
Q: A sample of 104 motels is selected from a large urban area and the price for a night of lodging for…
A: n = 104Mean = 100SD = 13One motel charged $68 per night which is 13th percentile Another motel…
Q: 2.2.2 A Starburst candy package contains 12 individual candy pieces. Each piece is equally likely to…
A: n = 12 There are four flovours berry, orange, lemon and cherry..All is equally likely.so the…
Q: A research center survey of 2,374 adults found that 1,854 had bought something online. Of these…
A: N = 2374 1854 had bought something elsen1 = 1854 1288 online weekly shoppersn2 = 1288 We have to…
Please help me dont do handwritten and explain evry concept and also why other options are incorrect or else please skip...


Trending now
This is a popular solution!

Step by step
Solved in 3 steps with 6 images

- Olympic Pole Vault The graph in Figure 7 indicates that in recent years the winning Olympic men’s pole vault height has fallen below the value predicted by the regression line in Example 2. This might have occurred because when the pole vault was a new event there was much room for improvement in vaulters’ performances, whereas now even the best training can produce only incremental advances. Let’s see whether concentrating on more recent results gives a better predictor of future records. (a) Use the data in Table 2 (page 176) to complete the table of winning pole vault heights shown in the margin. (Note that we are using x=0 to correspond to the year 1972, where this restricted data set begins.) (b) Find the regression line for the data in part ‚(a). (c) Plot the data and the regression line on the same axes. Does the regression line seem to provide a good model for the data? (d) What does the regression line predict as the winning pole vault height for the 2012 Olympics? Compare this predicted value to the actual 2012 winning height of 5.97 m, as described on page 177. Has this new regression line provided a better prediction than the line in Example 2?Suppose that a regional express delivery service company wants to estimate the cost of shipping a package (Y) as a function of cargo type, where cargo type includes the following possibilities: fragile, semi-fragile, and durable. Costs for 15 randomly chosen packages of approximately the same weight and same distance shipped, but of different cargo types, are provided in the file P14_16.xlsx. a. Estimate a regression equation using the given sample data, and interpret the estimated regression coefficients. b. According to the estimated regression equation, which cargo type is the most costly to ship? Which cargo type is the least costly to ship? c. How well does the estimated equation fit the given sample data? How might the fit be improved? d. Given the estimated regression equation, predict the cost of shipping a package with semi-fragile cargo.Which of the multivariate regression parameters listed below would be best interpreted as: the predicted value on the dependent variable when all of the independent variables in the model are equal to zero. a b1 X1 R2
- Given a generic data set (x,y) with a linear regression. How do you determine if the y(dependent) will be less/greater than a certain value at a decided value of x?The owner of Original Italian Pizza restaurant chain wants to understand which variable most strongly influences the sales of his specialty deep-dish pizza. He has gathered data on the monthly sales of deep-dish pizzas at his restaurants and observations on other potentially relevant variables for each of several outlets in central Indiana. These data are provided in the file P10_04.xlsx. Estimate a simple linear regression equation between the quantity sold (Y) and each of the following candidates for the best explanatory variable: average price of deep-dish pizzas (X1), monthly advertising expenditures (X2), and disposable income per household in the areas surrounding the outlets (X3). Round your answers for intercept coefficients to the nearest whole number and slope coefficients to two decimal places, if necessary. If your answer is negative number, enter "minus" sign.The systolic blood pressure dataset (in the third sheet of the spreadsheet linked above) contains the systolic blood pressure and age of 30 randomly selected patients in a medical facility. What is the equation for the least square regression line where the independent or predictor variable is age and the dependent or response variable is systolic blood pressure? Y=__________ X + ______________ Patient 7 is 67 years old and has a systolic blood pressure of 170 mm Hg. What is the residual? __________ mm Hg Is the actual value above, below, or on the line? What is the interpretation of the residual? (difference in actual &predicated bp, difference in age, the amount of systolic changes)
- A researcher was investigating variables that might be associated with the academic performance of high school students. The data included the average Math SAS score of all high school seniors in the city that took the exam (labeled as the variable SAT-M), the average number of dollars per pupil spent on education by the city (labeled as the variable $Per Pupil), and the percentage of high school seniors in the city that took the exam (labeled as the variable %Taking). The researcher ran the following multiple linear regression model as SAT-M=Beta0 + Beta1($Per Pupil) + Beta2(%Taking). This model was fit to the data using the method of least-squares, results shown inside of table within photo. If we want to test using ANOVA F-test with hypotheses Ho: Beta1=Beta2=0 versus H1: at least one of the Beta is not 0, what would the value of our F-statistic mean?In a simple linear regression, show that the OLS regression line always passes through the mean (average) of both x and y.The linregress() method in scipy module is used to fit a simple linear regression model using “Reaction” (reaction time) as the response variable and “Drinks” as the predictor variable. The output is shown below. What is the correct regression equation based on this output? Is this model statistically significant at 5% level of significance (alpha = 0.05)? Select one. Python script outputs for the linregress method. Slope equals 6.0000, intercept = 3.9999, rvalue = 0.9728, pvalue = 0.0011, stderror = 0.7141. Note: Python output shows many decimal places. All values Question 2 options: Reaction = 6.0000 + 3.9999 Drinks, model is not statistically significant Reaction = 6.0000 + 3.9999 Drinks, model is statistically significant Reaction = 3.9999 + 6.0000 Drinks, model is not statistically significant Reaction = 3.9999 + 6.0000 Drinks, model is statistically significant
- Given a generic data set (x,y) with a linear regression. How do you determine if the y(dependent) will be less than a certain value?You spilled water on your calculations from (a) and can't remember what your estimated regression parameters are. But you do have two possible estimated errors for each of your initial four observations:When is the standard error of the estimate (in linear regression) large? When the X values are very close to the Y values. When the residuals are large on average. When the average distance between actual Y scores and predicted Y scores is small. When the coefficient of determination is small.
