
MATLAB: An Introduction with Applications
6th Edition
ISBN: 9781119256830
Author: Amos Gilat
Publisher: John Wiley & Sons Inc
expand_more
expand_more
format_list_bulleted
Related questions
Question
Which
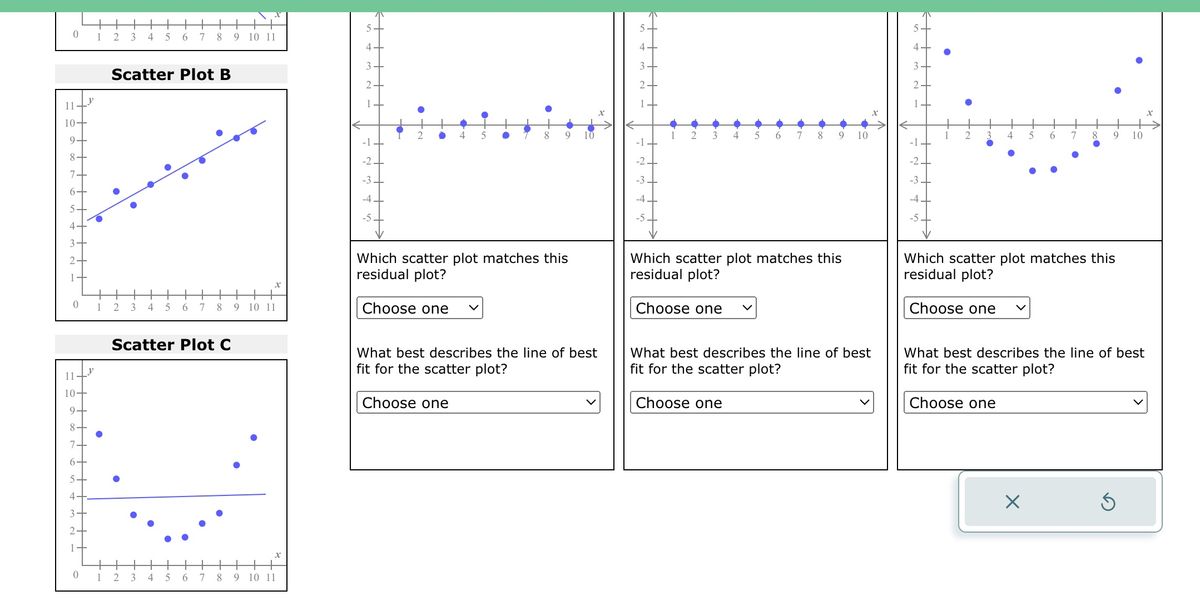
What best describes the line of best fit for the scatter plot? CHOICES: PERFECT MODEL, GOOD (BUT NOT PERFECT) MODEL, NOT AN APPROPRIATE MODEL

Transcribed Image Text:0
11
10-
8
4
3
11
10+
9.
8.
7
6
1 2 3
1
4
Scatter Plot B
1 2 3 4 5 6 7 8 9 10 11
2
5 6 7 8 9 10 11
Scatter Plot C
3
4
5
6
7 8
X
9 10 11
4
-1
-2
-3
-4
Choose one
5
●
Choose one
8
Which scatter plot matches this
residual plot?
9
10
What best describes the line of best
fit for the scatter plot?
-3
-4
2 3 4
Choose one
5
6
Choose one
7
8
Which scatter plot matches this
residual plot?
9
10
What best describes the line of best
fit for the scatter plot?
10
-3
-4
3 4
5
Choose one
6
X
7
Which scatter plot matches this
residual plot?
Choose one
9
What best describes the line of best
fit for the scatter plot?
10
Ś

Transcribed Image Text:10+
9
0
11
10-
11+2
10+
9
1
1
Scatter Plot A
2 3
4
2
Scatter Plot B
+
3 4
5 6 7 89 10 11
+ +
5 6 7 8
X
Scatter Plot C
9 10 11
Residual Plot 1
4 5
9
Which scatter plot matches this
residual plot?
Choose one
Choose one
What best describes the line of best
fit for the scatter plot?
<+++
1 2
Residual Plot 2
3
4
5 6 7 8 9 10
Which scatter plot matches this
residual plot?
Choose one
Choose one
What best describes the line of best
fit for the scatter plot?
-4
Residual Plot 3
3 4 5 6 7 8 9 10
Which scatter plot matches this
residual plot?
Choose one
What best describes the line of best
fit for the scatter plot?
Choose one
Expert Solution
arrow_forward
Step 1: Introduce the given plots
Given three scatter plots Scatter Plot A, Scatter Plot B, and Scatter Plot C with their lines of best fit between Residual Plot 1, Residual Plot 2, and Residual Plot 3.

Step by stepSolved in 3 steps

Knowledge Booster

Similar questions
- How do I do the scatter plot here? And did I get the r crit right?arrow_forwardPls help ASAParrow_forwardThe ordered pairs below give the winning times (in seconds) of a 100-meter freestyle swim race at a regularly-held competition from 1984 through 2012. (1984, 54.22) (2000, 52.13) (1988, 53.23) (2004, 52.14) (1992, 52.94) (2008, 51.42) (1996, 52.80) (2012, 51.30) (a) Sketch a scatter plot of the data. Let y represent the winning time (in seconds) and let t = 84 represent 1984. (b) Sketch the line that you think best approximates the data and find an equation of the line. (Round the slope and y-intercept to one decimal place.) y = (c) Use the regression feature of a graphing utility to find the equation of the least squares regression line that fits the data. (Round the slope and y-intercept to two decimal places.) y =arrow_forward
- Gradeboo t Content The data to the right shows the number of graduating students with business majors at a university over the last 15 275 269 263 257 Scor years. 249 242 236 231 1009 a Construct a box-and-whisker plot for this data. b. Identify the five-number summary. 223 216 210 204 y Plan 199 193 187 o & Resou 91.33% ary a) Choose the correct box-and-whisker plot of the data below. O B. OC. essible Res O A. 94.85% -chase Opti past due 250 300 mmunicati 150 200 150 200 250 300 150 200 250 300 b) The five-number summary is (Use ascending order.)arrow_forwardI can do the scatter plot diagram I just need help With identifying the Y axis and the X access and the Form directions strength And outlierarrow_forwardDoes the scatter plot appear linear? Strong or weak? Positive or negativearrow_forward
- (a) Find the five-number summary, and (b) draw a box-and-whisker plot of the data. 3 88 5 2 9 8 79 5 9 3 2 6 2 9 8 779 (a) Min = (Simplify your answer.) Q, = (Simplify your answer. Do not round.) Q2 (Simplify your answer. Do not round.) Q3 = (Simplify your answer. Do not round.) Max = (Simplify your answer.) (b) Choose the correct box-and-whisker plot below. OA. В. C. O D. 2 8. 2 4 8. 2 4 4 6. Foarrow_forwardPlease draw a scatter plot based on the data shown! Thank you!arrow_forward
arrow_back_ios
arrow_forward_ios
Recommended textbooks for you
- MATLAB: An Introduction with ApplicationsStatisticsISBN:9781119256830Author:Amos GilatPublisher:John Wiley & Sons Inc
 Probability and Statistics for Engineering and th...StatisticsISBN:9781305251809Author:Jay L. DevorePublisher:Cengage Learning
 Statistics for The Behavioral Sciences (MindTap C...StatisticsISBN:9781305504912Author:Frederick J Gravetter, Larry B. WallnauPublisher:Cengage Learning
  Elementary Statistics: Picturing the World (7th E...StatisticsISBN:9780134683416Author:Ron Larson, Betsy FarberPublisher:PEARSON
 The Basic Practice of StatisticsStatisticsISBN:9781319042578Author:David S. Moore, William I. Notz, Michael A. FlignerPublisher:W. H. Freeman
 Introduction to the Practice of StatisticsStatisticsISBN:9781319013387Author:David S. Moore, George P. McCabe, Bruce A. CraigPublisher:W. H. Freeman
MATLAB: An Introduction with Applications
Statistics
ISBN:9781119256830
Author:Amos Gilat
Publisher:John Wiley & Sons Inc
Probability and Statistics for Engineering and th...
Statistics
ISBN:9781305251809
Author:Jay L. Devore
Publisher:Cengage Learning
Statistics for The Behavioral Sciences (MindTap C...
Statistics
ISBN:9781305504912
Author:Frederick J Gravetter, Larry B. Wallnau
Publisher:Cengage Learning
Elementary Statistics: Picturing the World (7th E...
Statistics
ISBN:9780134683416
Author:Ron Larson, Betsy Farber
Publisher:PEARSON
The Basic Practice of Statistics
Statistics
ISBN:9781319042578
Author:David S. Moore, William I. Notz, Michael A. Fligner
Publisher:W. H. Freeman
Introduction to the Practice of Statistics
Statistics
ISBN:9781319013387
Author:David S. Moore, George P. McCabe, Bruce A. Craig
Publisher:W. H. Freeman