fx | Replicate # Replicate # Control Fertilized 0.362 0.315 0.398 0.624 0.419 0.478 0.143 0.332 0.445 0.392 0.053 0.098 0.114 0.13 0.317 0.71 10 0.443 0.373 11 10 0.36 0.203 12 11 0.026 0.611 13 12 0.545 0.404 14 13 0.308 0.481 15 14 0.376 0.698 16 15 0.212 0.616 17 16 0.057 0.415 18 17 0.44 0.593 19 18 0.097 0.244 20 19 0.373 0.779 21 20 0.144 0.616 22 21 0.283 0.498 23 22 0.58 0.018 24 23 0.429 0.03 25 24 0.196 0.686 26 25 0.197 0.366 0.129 0.301 27 26 28 27 0.269 0.019 29 28 0.246 0.653 30 29 0.383 0.124 31 30 0.247 0.353 32 t Table cumulative prob. t-0.5 t-0.75 t-0.80 t-0.85 t-0.90 t-0.95 t-0,975 t-0.99 t-0.995 t-0.999 one-tail 0.50 0.25 0.20 0.15 0.10 0.05 0.025 0.01 0.005 0.001 two-tails 1.00 0 50 0.40 0.30 0.20 0.10 0.05 001 0.02 0.002 df 0.000 1.000 1.376 1.963 3.078 6.314 12.71 31.82 63.66 318.31 0.000 0.816 1.061 1.386 1.886 2.920 4.303 6.965 9.925 22.327 0.000 0.765 0.978 1.250 1.638 2.353 3.182 4.541 5.841 10.215 0.000 0.741 0.941 1.190 1.533 2.132 2.776 3.747 4.604 7.173 0.000 0.727 0.920 1.156 1.476 2.015 2.571 3.365 4.032 5.893 0.000 0.718 0.906 1.134 1.440 1.943 2.447 3.143 3.707 5.208 0.000 0.711 0.896 1.119 1.415 1.895 2.365 2.998 3.499 4.785 0.000 0.706 0.889 1.108 1.397 1.860 2.306 2.896 3.355 4.501 0.000 0.703 0.883 1.100 1.383 1.833 2.262 2.821 3.250 4.297 10 0.000 0.700 0.879 1.093 1.327 1.812 2.228 2.764 3.169 4.144 11 0.000 0.697 0.876 1.088 1.363 1.796 2.201 2.718 3.106 4.025 12 0.000 0.695 0.873 1.083 1.356 1.782 2.179 2.681 3.055 3.930 13 0.000 0.694 0.870 1.079 1.350 1.771 2.160 2.650 3.012 3.852 14 0.000 0.692 0.868 1.076 1.345 1.761 2.145 2.624 2.977 3.787 15 0.000 0.691 0.866 1.074 1.341 1.753 2.131 2.602 2.947 3.733 16 0.000 0.690 0.865 1.071 1.337 1.746 2.120 2.583 2.921 3.686 17 0.000 0.689 0.863 1.069 1.333 1.740 2.110 2.567 2.898 3.646 18 0.000 0.688 0.862 1.067 1.330 1.734 2.101 2.552 2.878 3.610 19 0.000 0.688 0.861 1.066 1.328 1.729 2.093 2.539 2.861 3.597 20 0.000 0.687 0.860 1.064 1.325 1.725 2.086 2.528 2.845 3.552 21 0.000 0.686 0.859 1.063 1.323 1.721 2.080 2.518 2.831 3.527 22 0.000 0.686 0.858 1.061 1.321 1.717 2.074 2.508 2.819 3.505 23 0.000 0.685 0.858 1.060 1.319 1.714 2.069 2.500 2.807 3.485 24 0.000 0.685 0.857 1.059 1.318 1.711 2.064 2.492 2.797 3.467 25 0.000 0.684 0.856 1.058 1.316 1.708 2.060 2.485 2.787 3.450 26 0.000 0.684 0.856 1.058 1.315 1.706 2.056 2.479 2.779 3.435 27 0.000 0.684 0.855 1.057 1.314 1.703 2.052 2.473 2.771 3.421 28 0.000 0.683 0.855 1.056 1.313 1.701 2.048 2.467 2.763 3.408 29 0.000 0.683 0.854 1.055 1.311 1.699 2.045 2.462 2.756 3.396 30 0.000 0.683 0.854 1.055 1.310 1.697 2.042 2.457 2.750 3.385 40 0.000 0.681 0.851 1.050 1.303 1.684 2.021 2.423 2.704 3.307 60 0.000 0.679 0.848 1.045 1.296 1.671 2.000 2.390 2.660 3.232 80 0.000 0.678 0.846 1.043 1.292 1.664 1.990 2.374 2.639 3.195 100 0.000 0.677 0.845 1.042 1.290 1.660 1.984 2.364 2.626 3.174 1000 0.000 0.675 0.842 1.037 1.282 1.646 1.962 2.330 2.581 3.098

Glencoe Algebra 1, Student Edition, 9780079039897, 0079039898, 2018
18th Edition
ISBN:9780079039897
Author:Carter
Publisher:Carter
Chapter10: Statistics
Section: Chapter Questions
Problem 6SGR
icon
Related questions
icon
Concept explainers
Topic Video
Question

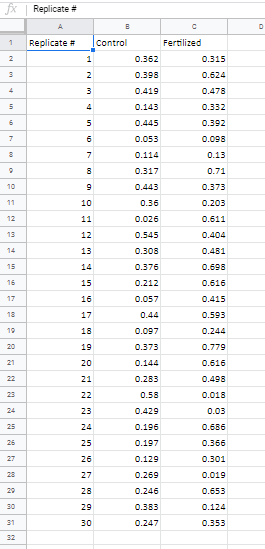
A soil scientist has just developed a new type of fertilizer and she wants to determine whether it helps carrots grow larger.  She sets up several pots of soil and plants one carrot seed in each pot.  Fertilizer is added to half the pots.  All the pots are placed in a temperature-controlled greenhouse where they receive adequate light and equal amounts of water. After two months of growth, the scientist harvests the carrots and weighs them (in kilograms).  Below is a data table showing the weight of the carrots at the end of the growing period from the two treatment groups.

When analyzing this dataset with a t-test, the  hypothesis states that the average size of the carrots from each treatment are the same, whereas the  hypothesis states that the fertilized carrots are larger in size.

To analyze this data set, should the scientist use a -tailed t-test? 

After performing a t-test, what is the calculated t-value for this data set?  (Round your answer to four decimal places)

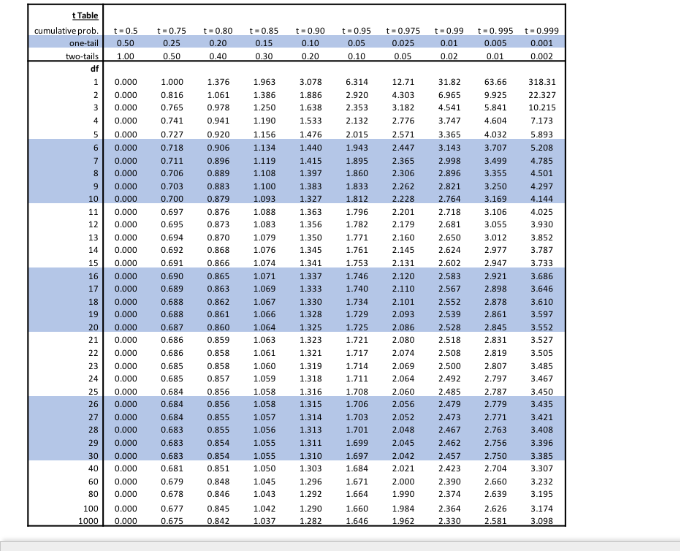
Use the table below to report the critical t-value for the appropriate t-test 

Would you reject or fail to reject the null hypothesis? 

fx | Replicate #
Replicate #
Control
Fertilized
0.362
0.315
0.398
0.624
0.419
0.478
0.143
0.332
0.445
0.392
0.053
0.098
0.114
0.13
0.317
0.71
10
0.443
0.373
11
10
0.36
0.203
12
11
0.026
0.611
13
12
0.545
0.404
14
13
0.308
0.481
15
14
0.376
0.698
16
15
0.212
0.616
17
16
0.057
0.415
18
17
0.44
0.593
19
18
0.097
0.244
20
19
0.373
0.779
21
20
0.144
0.616
22
21
0.283
0.498
23
22
0.58
0.018
24
23
0.429
0.03
25
24
0.196
0.686
26
25
0.197
0.366
0.129
0.301
27
26
28
27
0.269
0.019
29
28
0.246
0.653
30
29
0.383
0.124
31
30
0.247
0.353
32
Transcribed Image Text:fx | Replicate # Replicate # Control Fertilized 0.362 0.315 0.398 0.624 0.419 0.478 0.143 0.332 0.445 0.392 0.053 0.098 0.114 0.13 0.317 0.71 10 0.443 0.373 11 10 0.36 0.203 12 11 0.026 0.611 13 12 0.545 0.404 14 13 0.308 0.481 15 14 0.376 0.698 16 15 0.212 0.616 17 16 0.057 0.415 18 17 0.44 0.593 19 18 0.097 0.244 20 19 0.373 0.779 21 20 0.144 0.616 22 21 0.283 0.498 23 22 0.58 0.018 24 23 0.429 0.03 25 24 0.196 0.686 26 25 0.197 0.366 0.129 0.301 27 26 28 27 0.269 0.019 29 28 0.246 0.653 30 29 0.383 0.124 31 30 0.247 0.353 32
t Table
cumulative prob.
t-0.5
t-0.75
t-0.80
t-0.85
t-0.90
t-0.95
t-0,975
t-0.99
t-0.995 t-0.999
one-tail
0.50
0.25
0.20
0.15
0.10
0.05
0.025
0.01
0.005
0.001
two-tails
1.00
0 50
0.40
0.30
0.20
0.10
0.05
001
0.02
0.002
df
0.000
1.000
1.376
1.963
3.078
6.314
12.71
31.82
63.66
318.31
0.000
0.816
1.061
1.386
1.886
2.920
4.303
6.965
9.925
22.327
0.000
0.765
0.978
1.250
1.638
2.353
3.182
4.541
5.841
10.215
0.000
0.741
0.941
1.190
1.533
2.132
2.776
3.747
4.604
7.173
0.000
0.727
0.920
1.156
1.476
2.015
2.571
3.365
4.032
5.893
0.000
0.718
0.906
1.134
1.440
1.943
2.447
3.143
3.707
5.208
0.000
0.711
0.896
1.119
1.415
1.895
2.365
2.998
3.499
4.785
0.000
0.706
0.889
1.108
1.397
1.860
2.306
2.896
3.355
4.501
0.000
0.703
0.883
1.100
1.383
1.833
2.262
2.821
3.250
4.297
10
0.000
0.700
0.879
1.093
1.327
1.812
2.228
2.764
3.169
4.144
11
0.000
0.697
0.876
1.088
1.363
1.796
2.201
2.718
3.106
4.025
12
0.000
0.695
0.873
1.083
1.356
1.782
2.179
2.681
3.055
3.930
13
0.000
0.694
0.870
1.079
1.350
1.771
2.160
2.650
3.012
3.852
14
0.000
0.692
0.868
1.076
1.345
1.761
2.145
2.624
2.977
3.787
15
0.000
0.691
0.866
1.074
1.341
1.753
2.131
2.602
2.947
3.733
16
0.000
0.690
0.865
1.071
1.337
1.746
2.120
2.583
2.921
3.686
17
0.000
0.689
0.863
1.069
1.333
1.740
2.110
2.567
2.898
3.646
18
0.000
0.688
0.862
1.067
1.330
1.734
2.101
2.552
2.878
3.610
19
0.000
0.688
0.861
1.066
1.328
1.729
2.093
2.539
2.861
3.597
20
0.000
0.687
0.860
1.064
1.325
1.725
2.086
2.528
2.845
3.552
21
0.000
0.686
0.859
1.063
1.323
1.721
2.080
2.518
2.831
3.527
22
0.000
0.686
0.858
1.061
1.321
1.717
2.074
2.508
2.819
3.505
23
0.000
0.685
0.858
1.060
1.319
1.714
2.069
2.500
2.807
3.485
24
0.000
0.685
0.857
1.059
1.318
1.711
2.064
2.492
2.797
3.467
25
0.000
0.684
0.856
1.058
1.316
1.708
2.060
2.485
2.787
3.450
26
0.000
0.684
0.856
1.058
1.315
1.706
2.056
2.479
2.779
3.435
27
0.000
0.684
0.855
1.057
1.314
1.703
2.052
2.473
2.771
3.421
28
0.000
0.683
0.855
1.056
1.313
1.701
2.048
2.467
2.763
3.408
29
0.000
0.683
0.854
1.055
1.311
1.699
2.045
2.462
2.756
3.396
30
0.000
0.683
0.854
1.055
1.310
1.697
2.042
2.457
2.750
3.385
40
0.000
0.681
0.851
1.050
1.303
1.684
2.021
2.423
2.704
3.307
60
0.000
0.679
0.848
1.045
1.296
1.671
2.000
2.390
2.660
3.232
80
0.000
0.678
0.846
1.043
1.292
1.664
1.990
2.374
2.639
3.195
100
0.000
0.677
0.845
1.042
1.290
1.660
1.984
2.364
2.626
3.174
1000
0.000
0.675
0.842
1.037
1.282
1.646
1.962
2.330
2.581
3.098
Transcribed Image Text:t Table cumulative prob. t-0.5 t-0.75 t-0.80 t-0.85 t-0.90 t-0.95 t-0,975 t-0.99 t-0.995 t-0.999 one-tail 0.50 0.25 0.20 0.15 0.10 0.05 0.025 0.01 0.005 0.001 two-tails 1.00 0 50 0.40 0.30 0.20 0.10 0.05 001 0.02 0.002 df 0.000 1.000 1.376 1.963 3.078 6.314 12.71 31.82 63.66 318.31 0.000 0.816 1.061 1.386 1.886 2.920 4.303 6.965 9.925 22.327 0.000 0.765 0.978 1.250 1.638 2.353 3.182 4.541 5.841 10.215 0.000 0.741 0.941 1.190 1.533 2.132 2.776 3.747 4.604 7.173 0.000 0.727 0.920 1.156 1.476 2.015 2.571 3.365 4.032 5.893 0.000 0.718 0.906 1.134 1.440 1.943 2.447 3.143 3.707 5.208 0.000 0.711 0.896 1.119 1.415 1.895 2.365 2.998 3.499 4.785 0.000 0.706 0.889 1.108 1.397 1.860 2.306 2.896 3.355 4.501 0.000 0.703 0.883 1.100 1.383 1.833 2.262 2.821 3.250 4.297 10 0.000 0.700 0.879 1.093 1.327 1.812 2.228 2.764 3.169 4.144 11 0.000 0.697 0.876 1.088 1.363 1.796 2.201 2.718 3.106 4.025 12 0.000 0.695 0.873 1.083 1.356 1.782 2.179 2.681 3.055 3.930 13 0.000 0.694 0.870 1.079 1.350 1.771 2.160 2.650 3.012 3.852 14 0.000 0.692 0.868 1.076 1.345 1.761 2.145 2.624 2.977 3.787 15 0.000 0.691 0.866 1.074 1.341 1.753 2.131 2.602 2.947 3.733 16 0.000 0.690 0.865 1.071 1.337 1.746 2.120 2.583 2.921 3.686 17 0.000 0.689 0.863 1.069 1.333 1.740 2.110 2.567 2.898 3.646 18 0.000 0.688 0.862 1.067 1.330 1.734 2.101 2.552 2.878 3.610 19 0.000 0.688 0.861 1.066 1.328 1.729 2.093 2.539 2.861 3.597 20 0.000 0.687 0.860 1.064 1.325 1.725 2.086 2.528 2.845 3.552 21 0.000 0.686 0.859 1.063 1.323 1.721 2.080 2.518 2.831 3.527 22 0.000 0.686 0.858 1.061 1.321 1.717 2.074 2.508 2.819 3.505 23 0.000 0.685 0.858 1.060 1.319 1.714 2.069 2.500 2.807 3.485 24 0.000 0.685 0.857 1.059 1.318 1.711 2.064 2.492 2.797 3.467 25 0.000 0.684 0.856 1.058 1.316 1.708 2.060 2.485 2.787 3.450 26 0.000 0.684 0.856 1.058 1.315 1.706 2.056 2.479 2.779 3.435 27 0.000 0.684 0.855 1.057 1.314 1.703 2.052 2.473 2.771 3.421 28 0.000 0.683 0.855 1.056 1.313 1.701 2.048 2.467 2.763 3.408 29 0.000 0.683 0.854 1.055 1.311 1.699 2.045 2.462 2.756 3.396 30 0.000 0.683 0.854 1.055 1.310 1.697 2.042 2.457 2.750 3.385 40 0.000 0.681 0.851 1.050 1.303 1.684 2.021 2.423 2.704 3.307 60 0.000 0.679 0.848 1.045 1.296 1.671 2.000 2.390 2.660 3.232 80 0.000 0.678 0.846 1.043 1.292 1.664 1.990 2.374 2.639 3.195 100 0.000 0.677 0.845 1.042 1.290 1.660 1.984 2.364 2.626 3.174 1000 0.000 0.675 0.842 1.037 1.282 1.646 1.962 2.330 2.581 3.098
Expert Solution
trending now

Trending now

This is a popular solution!

steps

Step by step

Solved in 4 steps with 3 images

Blurred answer
Knowledge Booster
Application of Algebra
Learn more about
Need a deep-dive on the concept behind this application? Look no further. Learn more about this topic, statistics and related others by exploring similar questions and additional content below.
Similar questions
  • SEE MORE QUESTIONS
Recommended textbooks for you
Glencoe Algebra 1, Student Edition, 9780079039897…
Algebra
ISBN:
9780079039897
Author:
Carter
Publisher:
McGraw Hill