Gentle Ben is a Morgan horse at a Colorado dude ranch. Over the past 8 weeks, a veterinarian tock the following glucose readings from this horse (in ma/100 m). 94 89 81 106 98 110 6 91 The sample mean isx94.4. Let x be a random variable representing glucose readings taken from Gentie Ben. We may assume that x has a normal distribution, and we know from past experience that a- 12.5. The mean glucose level for horses should be - 85 mg/100 mi. De these data indicate that Gentle Ben has an overal average glucose level higher than 8S? Use a- 0.05. (a) What is the level of significance? State the null and alternate hypocheses. Will you use a left-taled, righe-talled, or bwo-taled best *Hai- 85; M.: > 85; right-taled O Hgi 85, M -85, right-tailed O Hg: -85; 85, left-taled Hg: 85; H 85; two-taled (b) What sampling distribution will yocu use? Explain the rationale for your cholce of samping distribution. O The standard normal, since we assume that x has a normal distribution with unknown e. O The Studene's, since a is large with unknown a. l O The Student's t, since we assume that x has a normal distribution with known e. The standard normal, since we assume that x has a normal distribution with known o. Compute the z value of the sample test statistic. (Round your ansiwer to two decimal places.) 213 (c) Find for estimate) the Pvalue. (Round your answer to four desimal places.) Sketch the sampling distribution and show the area coresponding to the Pvalue. -3 -2 -1 3 -2 -1 1 -3 -2 -1 -2 -1 2 2 Based on your answers in parts (a) to (), will you reject or fail to reject the nul hypothesis? Are the data statistically significant at level a? At the a-0.05 level, we reject the nul hypothesis and conclude the data are statistically significant. A the a-0.05 level, we reject the nut hypothesis and conclude the data are not szatistically signircane At the a0.05 level, we fall to reject the null hypothesis and concude the data are statistically significant. At the a-0.05 level, we fall to reject the null hypothesis and conciude the data are not statistically significant. (e) State your conciusion in the context of the application. * There is suffcient evidence at the 0.05 level to condude that Gente Ben's gluccse is higher than 85 mg/100 ml. O There is insufficent evidence at the 0.05 level to conclude that Gentle Ben's glucose is higher than 85 mg/100 ml.
Gentle Ben is a Morgan horse at a Colorado dude ranch. Over the past 8 weeks, a veterinarian tock the following glucose readings from this horse (in ma/100 m). 94 89 81 106 98 110 6 91 The sample mean isx94.4. Let x be a random variable representing glucose readings taken from Gentie Ben. We may assume that x has a normal distribution, and we know from past experience that a- 12.5. The mean glucose level for horses should be - 85 mg/100 mi. De these data indicate that Gentle Ben has an overal average glucose level higher than 8S? Use a- 0.05. (a) What is the level of significance? State the null and alternate hypocheses. Will you use a left-taled, righe-talled, or bwo-taled best *Hai- 85; M.: > 85; right-taled O Hgi 85, M -85, right-tailed O Hg: -85; 85, left-taled Hg: 85; H 85; two-taled (b) What sampling distribution will yocu use? Explain the rationale for your cholce of samping distribution. O The standard normal, since we assume that x has a normal distribution with unknown e. O The Studene's, since a is large with unknown a. l O The Student's t, since we assume that x has a normal distribution with known e. The standard normal, since we assume that x has a normal distribution with known o. Compute the z value of the sample test statistic. (Round your ansiwer to two decimal places.) 213 (c) Find for estimate) the Pvalue. (Round your answer to four desimal places.) Sketch the sampling distribution and show the area coresponding to the Pvalue. -3 -2 -1 3 -2 -1 1 -3 -2 -1 -2 -1 2 2 Based on your answers in parts (a) to (), will you reject or fail to reject the nul hypothesis? Are the data statistically significant at level a? At the a-0.05 level, we reject the nul hypothesis and conclude the data are statistically significant. A the a-0.05 level, we reject the nut hypothesis and conclude the data are not szatistically signircane At the a0.05 level, we fall to reject the null hypothesis and concude the data are statistically significant. At the a-0.05 level, we fall to reject the null hypothesis and conciude the data are not statistically significant. (e) State your conciusion in the context of the application. * There is suffcient evidence at the 0.05 level to condude that Gente Ben's gluccse is higher than 85 mg/100 ml. O There is insufficent evidence at the 0.05 level to conclude that Gentle Ben's glucose is higher than 85 mg/100 ml.

MATLAB: An Introduction with Applications
6th Edition
ISBN:9781119256830
Author:Amos Gilat
Publisher:Amos Gilat
Chapter1: Starting With Matlab
Section: Chapter Questions
Problem 1P

Related questions

Concept explainers
Contingency Table
A contingency table can be defined as the visual representation of the relationship between two or more categorical variables that can be evaluated and registered. It is a categorical version of the scatterplot, which is used to investigate the linear relationship between two variables. A contingency table is indeed a type of frequency distribution table that displays two variables at the same time.
Binomial Distribution
Binomial is an algebraic expression of the sum or the difference of two terms. Before knowing about binomial distribution, we must know about the binomial theorem.
Topic Video
Question
Hi could you answer the wrong problems
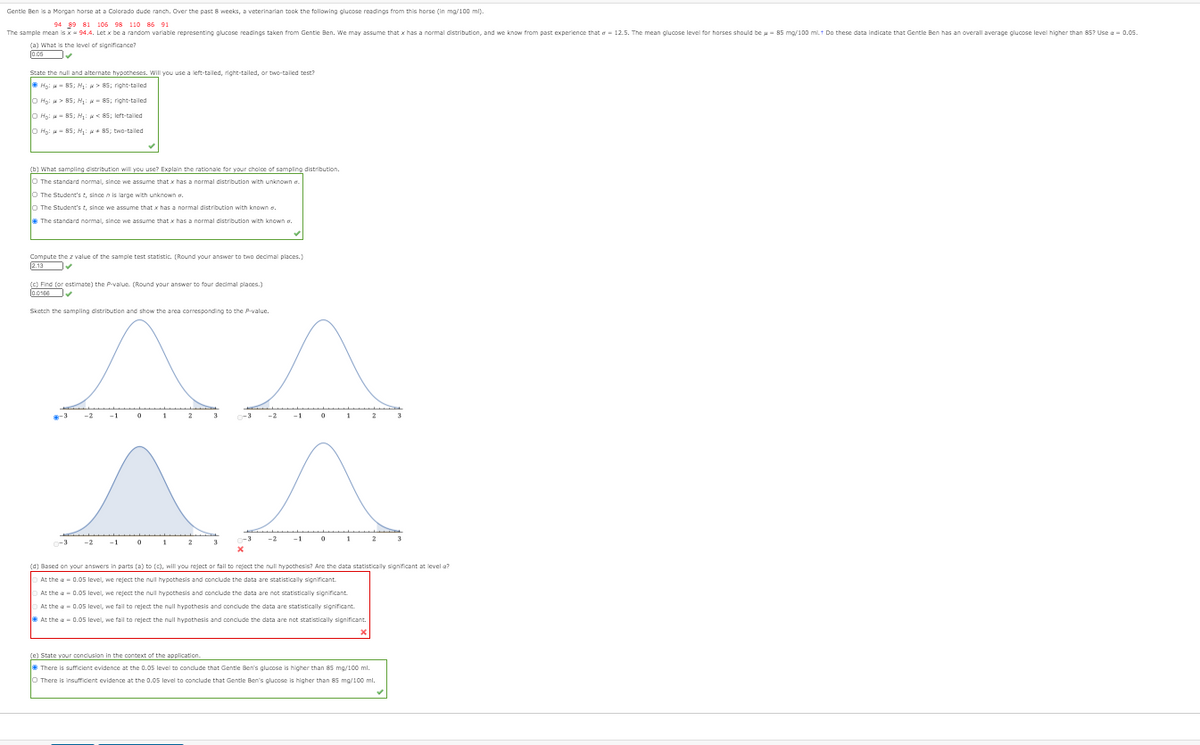
Transcribed Image Text:Gentle Ben is a Morgan horse at a Colorado dude ranch. Over the past 8 weeks, a veterinarian took the following glucose readings from this horse (in ma/100 ml).
94 89 81 106 98 110 85 91
The sample mean is x 94.4. Let x be a random variable representing glucose readings taken from Gentie Ben. We may assume that x has a normal distribution, and we know from past experience that a- 12.5. The mean glucose level for horses should be u- 85 mg/100 mlt Do these data indicate that Gentle Ben has an overall average glucose level higher than 85? Use a - 0.05.
(a) What is the level of significance?
(0.06
State the null and alternate hypotheses. Will you use a left-tailed, right-tailed, or two-tailed test?
Hp: - 85; H > 85; right-talled
O Ho: 85, H:- 85; right-talled
O Hp: 85; H < 85; left-tailed
O Hp: H-85; H B5; two-tailed
(b) What sampling distribution will you use? Explain the rationale for your choice of sampling distribution.
The standard normal, since we assume that x has a normal distribution with unknown a
O The Student's t, since n is large with unknown o.
lo The Student's t, since we assume that x has a normal distribution with known e.
E The standard normal, since we assume that x has a normal distribution with known a.
Compute the z value of the sample test statistic. (Round your answer to two decimal places.)
2.13
(C) Find (or estimate) the P-value (Round your answer to four decimal places.)
Sketch the sampling distribution and show the area corresponding to the P-value.
-3
-2
-1
1
-3
-2
-1
1
2
-3
-2
-1
2
3
-3
-2
-1
1
2
(d) Based on your answers in parts (a) to (c), will you reject or fail to reject the null hypothesis? Are the data statistically significant at level a?
At the a- 0.05 level, we reject the null hypothesis and conclude the data are statistically significant.
O At the a- 0.05 level, we reject the nul hypothesis and conclude the data are not statstically significant.
O At the a- 0.05 level, we fail to reject the null hypothesis and conclude the data are statistically significant.
At the a- 0.05 level, we fail to reject the null hypothesis and conciude the data are not statistically significant.
(e) State your conciusion in the context of the application.
* There is sufficient evidence at the 0.05 level to conclude that Gentle Ben's glucose is higher than 85 mg/100 ml.
O There is insufficient evidence at the 0.05 level to conclude that Gentle Ben's glucose is higher than 85 mg/100 ml.
Expert Solution
This question has been solved!
Explore an expertly crafted, step-by-step solution for a thorough understanding of key concepts.

This is a popular solution!

Trending now
This is a popular solution!

Step by step
Solved in 2 steps

Knowledge Booster


Learn more about
Need a deep-dive on the concept behind this application? Look no further. Learn more about this topic, statistics and related others by exploring similar questions and additional content below.Recommended textbooks for you
MATLAB: An Introduction with Applications
Statistics
ISBN:
9781119256830
Author:
Amos Gilat
Publisher:
John Wiley & Sons Inc

Probability and Statistics for Engineering and th…
Statistics
ISBN:
9781305251809
Author:
Jay L. Devore
Publisher:
Cengage Learning

Statistics for The Behavioral Sciences (MindTap C…
Statistics
ISBN:
9781305504912
Author:
Frederick J Gravetter, Larry B. Wallnau
Publisher:
Cengage Learning
MATLAB: An Introduction with Applications
Statistics
ISBN:
9781119256830
Author:
Amos Gilat
Publisher:
John Wiley & Sons Inc
Probability and Statistics for Engineering and th…
Statistics
ISBN:
9781305251809
Author:
Jay L. Devore
Publisher:
Cengage Learning
Statistics for The Behavioral Sciences (MindTap C…
Statistics
ISBN:
9781305504912
Author:
Frederick J Gravetter, Larry B. Wallnau
Publisher:
Cengage Learning

Elementary Statistics: Picturing the World (7th E…
Statistics
ISBN:
9780134683416
Author:
Ron Larson, Betsy Farber
Publisher:
PEARSON

The Basic Practice of Statistics
Statistics
ISBN:
9781319042578
Author:
David S. Moore, William I. Notz, Michael A. Fligner
Publisher:
W. H. Freeman

Introduction to the Practice of Statistics
Statistics
ISBN:
9781319013387
Author:
David S. Moore, George P. McCabe, Bruce A. Craig
Publisher:
W. H. Freeman