Given in the table are the BMI statistics for random samples of men and women. Assume that the two samples are independent simple random samples selected from normally distributed populations, and do not assume that the population standard deviations are equal. Complete parts (a) and (b) below. Use a 0.05 significance level for both parts. Male BMI Female BMI 44 27.0185 S 7.260314 44 25.6455 5.602988 The test statistic, t, is (Round to two decimal places as needed.) The P-value is (Round to three decimal places as needed.) State the conclusion for the test O A. Reject the null hypothesis. There is sufficient evidence to warrant rejection of the claim that men and women have the same mean BMI. O B. Fail to reject the null hypothesis. There is sufficient evidence warrant rejection of the claim that men and women have the same mean BMI. O C. Fail to reject the null hypothesis. There is not sufficient evidence to warrant rejection of the claim that men and women have the same mean BMI. O D. Reject the null hypothesis. There is not sufficient evidence to warrant rejection of the claim that men and women have the same mean BMI. b. Construct a confidence interval suitable for testing the claim that males and females have the same mean BMI. (Round to three decimal places as needed.)
Given in the table are the BMI statistics for random samples of men and women. Assume that the two samples are independent simple random samples selected from normally distributed populations, and do not assume that the population standard deviations are equal. Complete parts (a) and (b) below. Use a 0.05 significance level for both parts. Male BMI Female BMI 44 27.0185 S 7.260314 44 25.6455 5.602988 The test statistic, t, is (Round to two decimal places as needed.) The P-value is (Round to three decimal places as needed.) State the conclusion for the test O A. Reject the null hypothesis. There is sufficient evidence to warrant rejection of the claim that men and women have the same mean BMI. O B. Fail to reject the null hypothesis. There is sufficient evidence warrant rejection of the claim that men and women have the same mean BMI. O C. Fail to reject the null hypothesis. There is not sufficient evidence to warrant rejection of the claim that men and women have the same mean BMI. O D. Reject the null hypothesis. There is not sufficient evidence to warrant rejection of the claim that men and women have the same mean BMI. b. Construct a confidence interval suitable for testing the claim that males and females have the same mean BMI. (Round to three decimal places as needed.)

MATLAB: An Introduction with Applications
6th Edition
ISBN:9781119256830
Author:Amos Gilat
Publisher:Amos Gilat
Chapter1: Starting With Matlab
Section: Chapter Questions
Problem 1P

Related questions
Question
Transcribed Image Text:Male BMI
Female BMI
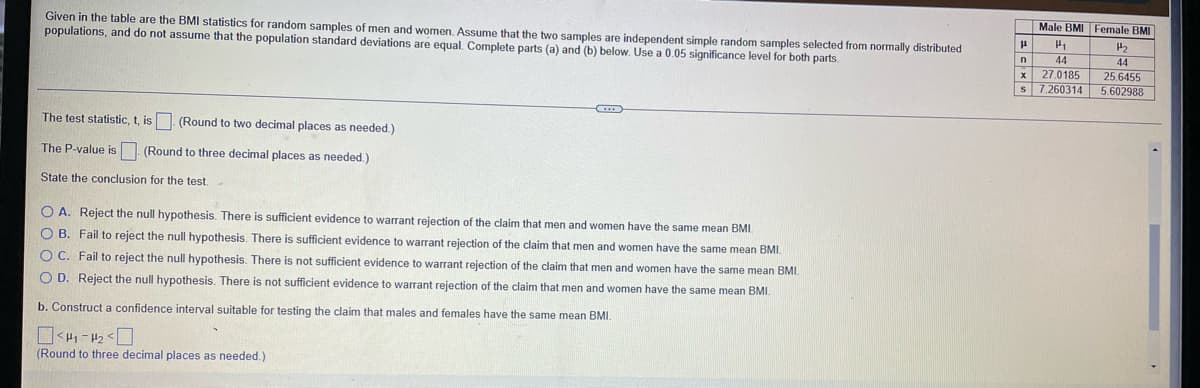
Given in the table are the BMI statistics for random samples of men and women, Assume that the two samples are independent simple random samples selected from normally distributed
populations, and do not assume that the population standard deviations are equal. Complete parts (a) and (b) below. Use a 0.05 significance level for both parts.
44
44
25.6455
S 7.260314 5.602988
n
x 27.0185
The test statistic, t, is. (Round to two decimal places as needed.)
The P-value is (Round to three decimal places as needed.)
State the conclusion for the test.
O A. Reject the null hypothesis. There is sufficient evidence to warant rejection of the claim that men and women have the same mean BMI.
O B. Fail to reject the null hypothesis. There
sufficient evidence to warrant rejection of the claim that men and women have the same mean BMI.
O C. Fail to reject the null hypothesis. There is not sufficient evidence to warrant rejection of the claim that men and women have the same mean BMI.
O D. Reject the null hypothesis. There is not sufficient evidence to warrant rejection of the claim that men and women have the same mean BMI.
b. Construct a confidence interval suitable for testing the claim that males and females have the same mean BMI.
(Round to three decimal places as needed.)
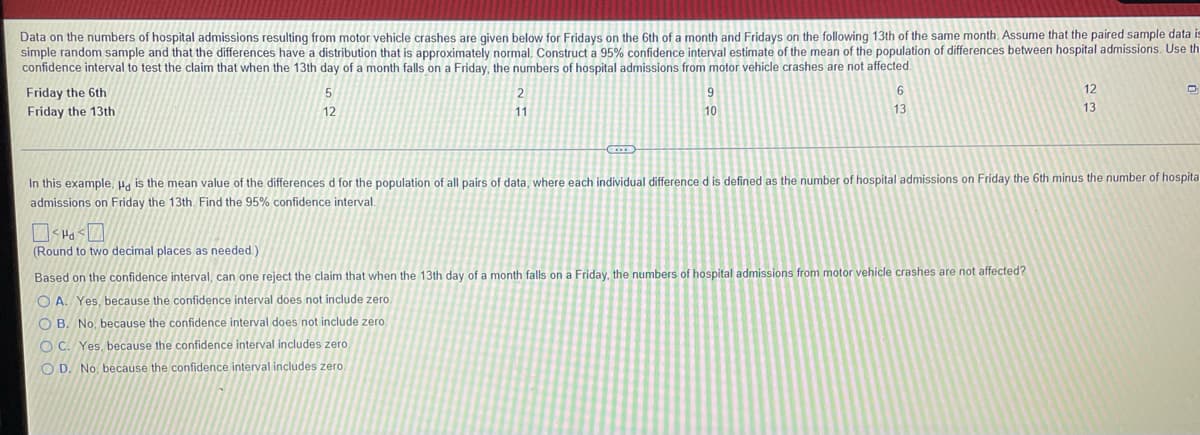
Transcribed Image Text:Data on the numbers of hospital admissions resulting from motor vehicle crashes are given below for Fridays on the 6th of a month and Fridays on the following 13th of the same month. Assume that the paired sample data i
simple randonm sample and that the differences have a distribution that is approximately normal, Construct a 95% confidence interval estimate of the mean of the population of differences between hospital admissions. Use th
confidence interval to test the claim that when the 13th day of a month falls on a Friday, the numbers of hospital admissions from motor vehicle crashes are not affected.
Friday the 6th
6.
12
Friday the 13th
10
13
13
12
11
In this example, H. is the mean value of the differences d for the population of all pairs of data, where each individual difference d is defined as the number of hospital admissions on Friday the 6th minus the number of hospita
admissions on Friday the 13th. Find the 95% confidence interval.
(Round to two decimal places as needed.)
Based on the confidence interval, can one reject the claim that when the 13th day of a month falls on a Friday, the numbers of hospital admissions from motor vehicle crashes are not affected?
O A. Yes, because the confidence interval does not include zero.
O B. No, because the confidence interval does not include zero.
O C. Yes, because the confidence interval includes zero.
O D. No, because the confidence interval includes zero.
Expert Solution
This question has been solved!
Explore an expertly crafted, step-by-step solution for a thorough understanding of key concepts.

Step by step
Solved in 4 steps with 2 images

Recommended textbooks for you
MATLAB: An Introduction with Applications
Statistics
ISBN:
9781119256830
Author:
Amos Gilat
Publisher:
John Wiley & Sons Inc

Probability and Statistics for Engineering and th…
Statistics
ISBN:
9781305251809
Author:
Jay L. Devore
Publisher:
Cengage Learning

Statistics for The Behavioral Sciences (MindTap C…
Statistics
ISBN:
9781305504912
Author:
Frederick J Gravetter, Larry B. Wallnau
Publisher:
Cengage Learning
MATLAB: An Introduction with Applications
Statistics
ISBN:
9781119256830
Author:
Amos Gilat
Publisher:
John Wiley & Sons Inc
Probability and Statistics for Engineering and th…
Statistics
ISBN:
9781305251809
Author:
Jay L. Devore
Publisher:
Cengage Learning
Statistics for The Behavioral Sciences (MindTap C…
Statistics
ISBN:
9781305504912
Author:
Frederick J Gravetter, Larry B. Wallnau
Publisher:
Cengage Learning

Elementary Statistics: Picturing the World (7th E…
Statistics
ISBN:
9780134683416
Author:
Ron Larson, Betsy Farber
Publisher:
PEARSON

The Basic Practice of Statistics
Statistics
ISBN:
9781319042578
Author:
David S. Moore, William I. Notz, Michael A. Fligner
Publisher:
W. H. Freeman

Introduction to the Practice of Statistics
Statistics
ISBN:
9781319013387
Author:
David S. Moore, George P. McCabe, Bruce A. Craig
Publisher:
W. H. Freeman